SOXS 76-day bearish forecast — Nov 1, 2026
- Bias: Bearish
- Timeframe: 76 days (made Nov 1, 2026, target date Jan 15, 2027)
- Price at analysis: $52.08
- Price target: $44.50
- Expected range: $38.50 – $53.50
- Result: Pending — graded after the close on Jan 15, 2027
Get a free AI analysis of SOXS today
Analysis
TECHNICAL INDICATORS
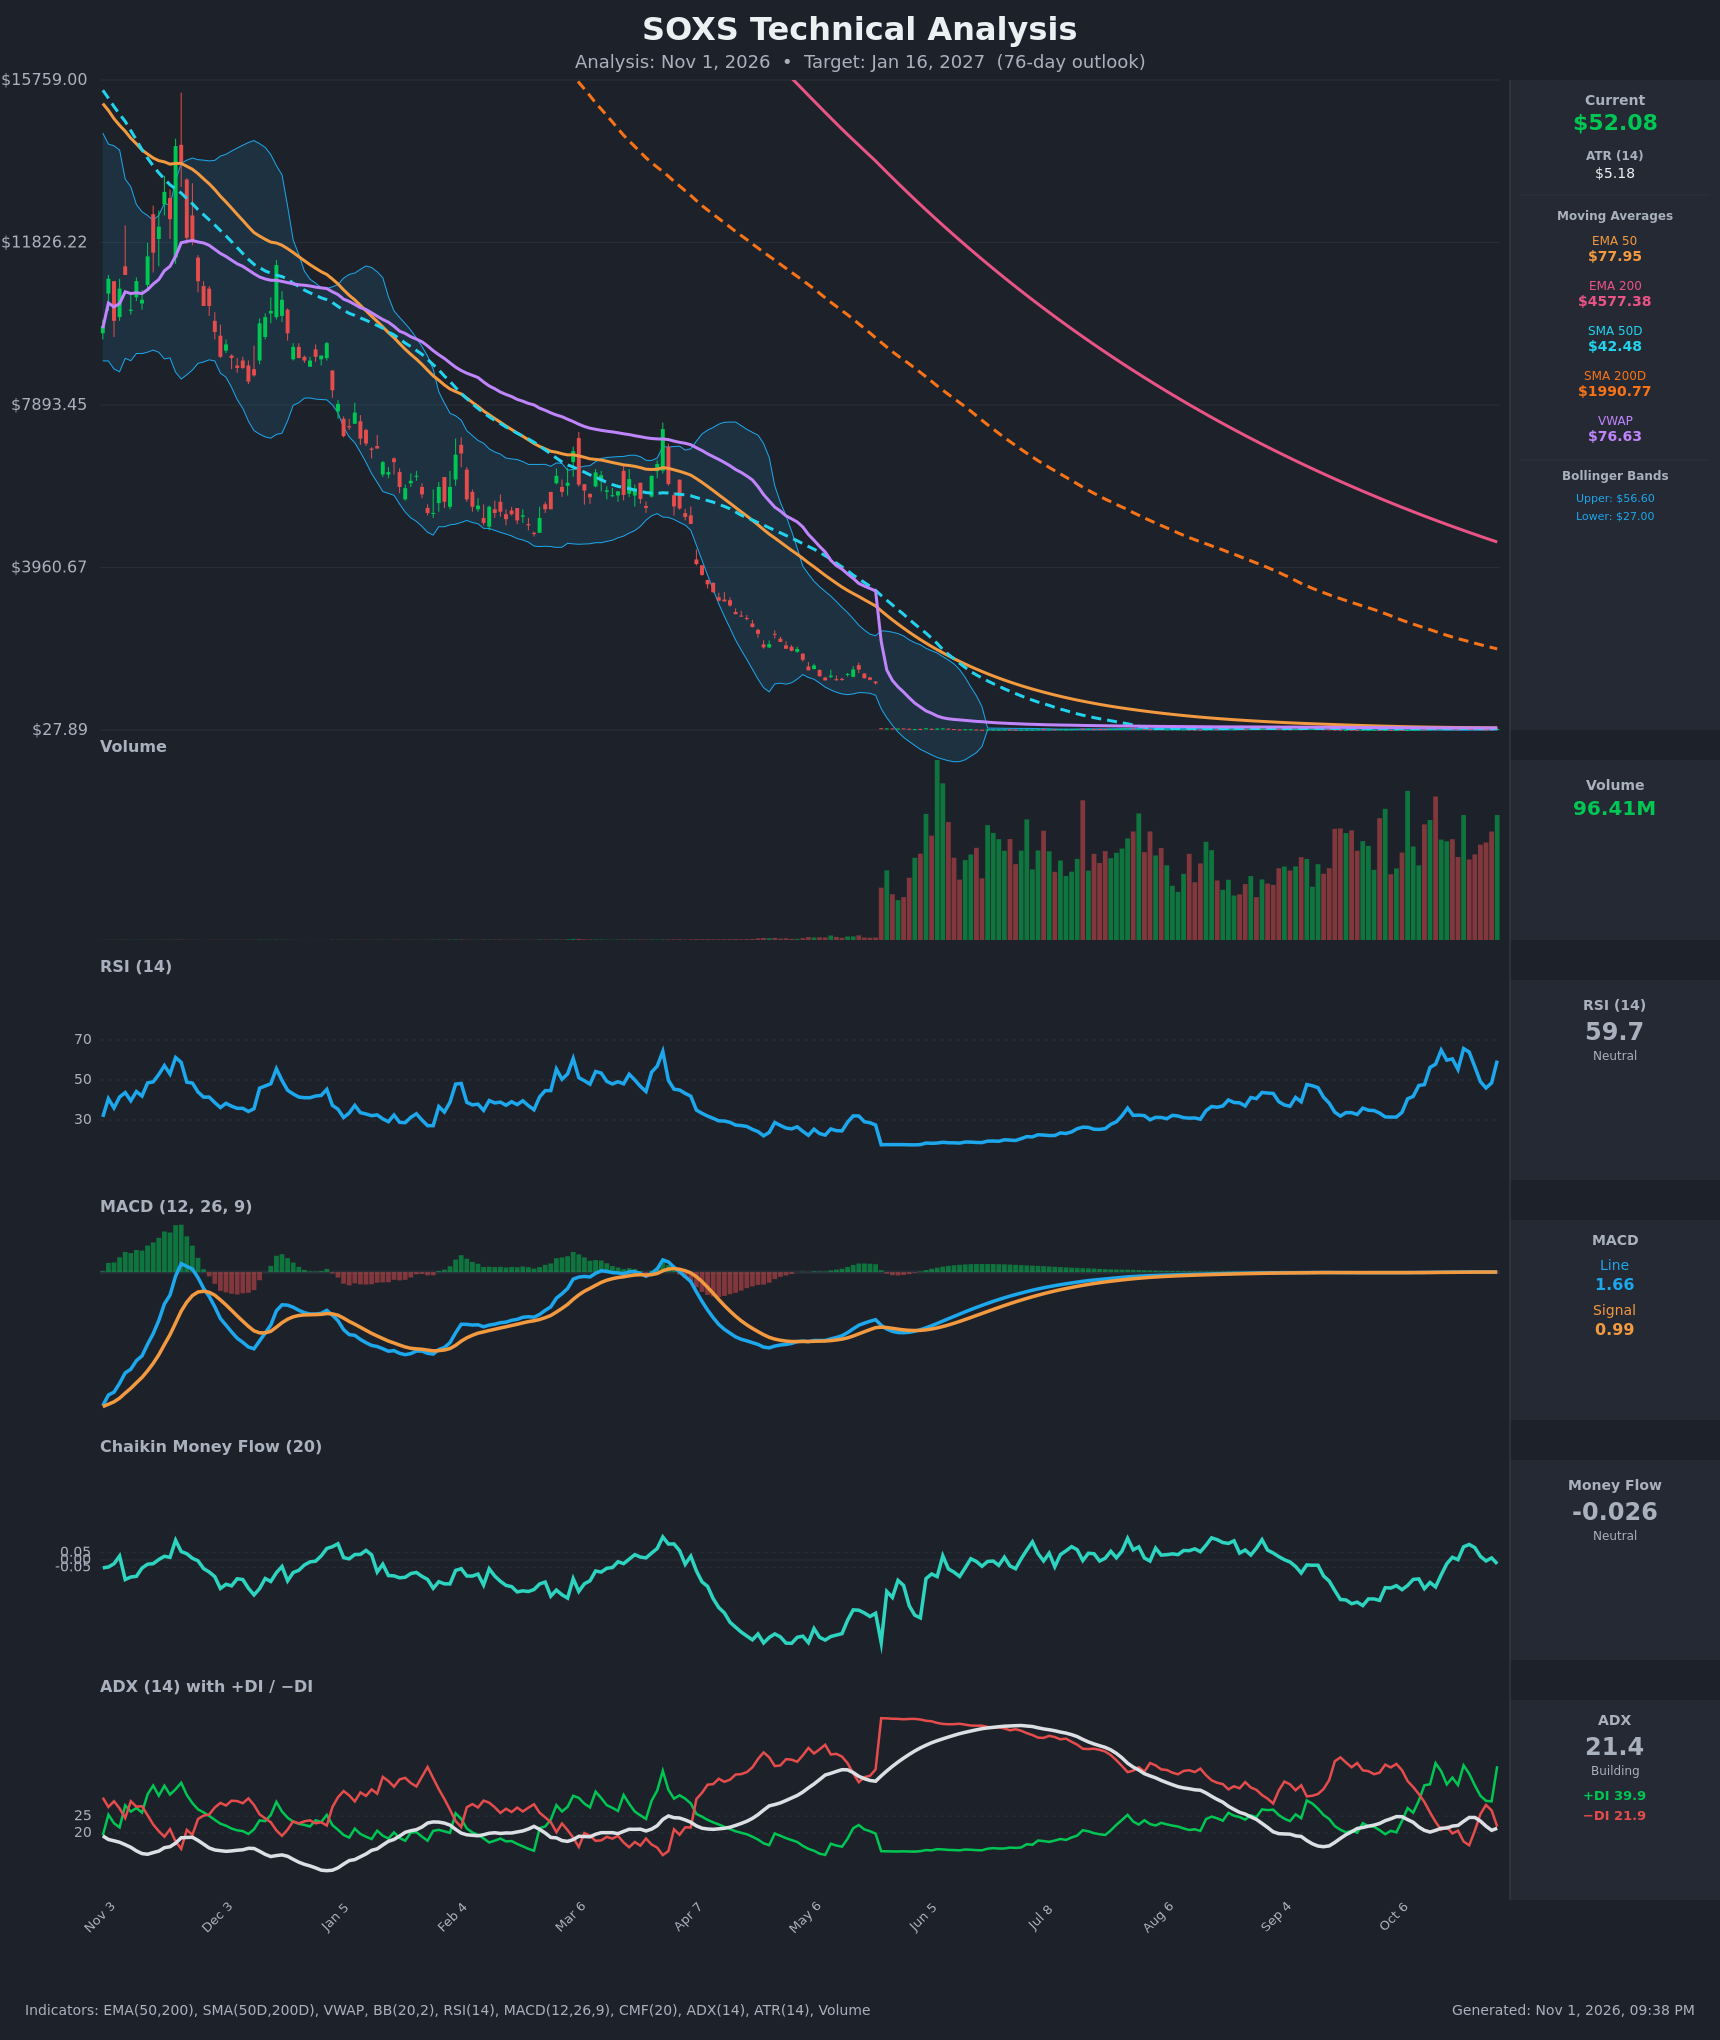
- RSI (14): 59.69, up from 48.5 two bars ago after a sharp one-day jump. It has been in the 46-66 range for two weeks and is not overbought, so there is some room to run. Momentum is positive but choppy. [Neutral]
- 20 EMA: Not supplied, so the 50-period values are used. Price of $52.08 is far below EMA50 ($77.95) and EMA200 ($4,577), which are distorted by reverse-split-adjusted history. Price is above SMA50D ($42.48), which is acting as near-term support. The longer averages are overhead resistance in a persistent downtrend. [Bearish]
- MACD: Line 1.66 is above signal 0.99, with a positive and expanding histogram. The bullish crossover occurred around Oct 19-20, and the line dipped from 2.32 to 1.08 before turning up again. This is a short-term bullish signal on a deeply compressed long-term scale. [Bullish]
- Bollinger Bands (20): Upper $56.60, lower $27.00, so the midline is about $41.80. Price is in the upper third of a wide band, about $4.50 below the upper band. Band width shows high volatility, and moves to the upper half have tended to mean-revert toward the midline. [Neutral]
- CMF (20): -0.026, inside the ±0.05 neutral band, and it has oscillated around zero for two weeks. A 25% one-day rally without a CMF breakout shows weak accumulation conviction. [Neutral]
- ADX (14): 21.4 with +DI at 39.9 and −DI at 21.9. +DI is on top, but ADX is barely above 20, so the trend is weak and the market is swinging in a wide range rather than trending. [Weak Trend, Bullish lean]
- Volume: 96.41M, steady and elevated versus most of the history, with no clear climax. The Oct 30 jump came on healthy volume, but there is no sign of a breakout surge. [Neutral / confirms volatility]
DIVERGENCES & TRENDS
- Long-term trend: Price has fallen continuously, which is consistent with the structural decay of a leveraged inverse ETF. It sits far below EMA50, EMA200 and VWAP ($76.63), and SMA50D ($42.48) is far below SMA200D ($1,990.77). That is a persistent death-cross configuration.
- Short-term: Over the last 15 bars price swung between $37 and $53.45 with daily moves of 10-25%. MACD crossed up, +DI crossed above −DI and RSI recovered, so short-term momentum is up.
- Resistance retests: Oct 22 ($53.45) and Oct 30 ($52.08) form a potential double-top area near $53. Each spike was followed by a drop of over 20% within 4 bars (Oct 22 to Oct 28: $53.45 to $39.78).
- Divergence: No clear RSI/price divergence. CMF is flat despite the price jump, which is a mild negative.
- ADX at 21.4: This signals range-bound, whipsaw conditions rather than a confirmed trend reversal.
CHART PATTERNS
- Bearish Double Top (low confidence): Peaks at about $53.45 and $52.08 with a trough near $39.78. A break below the neckline at about $39.80 would target about $26-27 (a measured move of roughly $13.50), which lines up with the lower Bollinger Band.
- Broader range: Price is moving in a $37-$53.50 channel, which resembles a volatile consolidation (a loose triple-top or rectangle).
- Downtrend context: The longer-term pattern on the chart is a sustained descending channel with price below all long-term MAs. This favors a bearish resolution on rallies.
POTENTIAL SCENARIOS
- Scenario 1: Bearish Rejection at $53 and Mean Reversion — Price fails at the $52-$53.50 double-top zone and drifts back toward the SMA50D and BB midline, helped by volatility decay and a flat CMF. Trigger: daily close below $47 and a MACD bearish cross. Target: $42-$44, with an extension to $38 if SMA50D breaks. Invalidation: daily close above $56.60. (50% probability)
- Scenario 2: Bullish Breakout Above Resistance — +DI dominance and the MACD cross carry price through $53.45 to the upper band, and an ADX rise above 25 confirms a new uptrend. Trigger: close above $54 on rising volume. Target: $60-$65. Invalidation: close back below $47. (30% probability)
- Scenario 3: Neutral Range Chop — Price continues oscillating inside the $38-$53 range with weak ADX. Trigger: repeated closes between $42 and $52. Target: $46-$50. Invalidation: a close outside $37-$56. (20% probability)
PRICE TARGETS
- Target Price: $44.50 (76-day horizon)
- Expected Range: $38.50 to $53.50 (width $15.00, about 28.8% of current price, consistent with the 61-180 day guidance)
- Key Levels: Support at $42.48 (SMA50D), Resistance at $53.45 (double-top high)
OVERALL BIAS
OVERALL BIAS: BEARISH - Price is stalling at the $52-$53.50 resistance, which was rejected twice, while the structural downtrend (below the EMA50, EMA200 and VWAP) and weak ADX/flat CMF argue against the rally holding. Short-term MACD and +DI strength lowers conviction, but mean reversion toward the SMA50D and midline looks more likely over 76 days.
This is educational analysis and not financial advice.