SOFI 76-day bullish forecast — Nov 1, 2026
- Bias: Bullish
- Timeframe: 76 days (made Nov 1, 2026, target date Jan 15, 2027)
- Price at analysis: $16.76
- Price target: $18.30
- Expected range: $15.20 – $19.40
- Result: Pending — graded after the close on Jan 15, 2027
Get a free AI analysis of SOFI today
Analysis
TECHNICAL INDICATORS
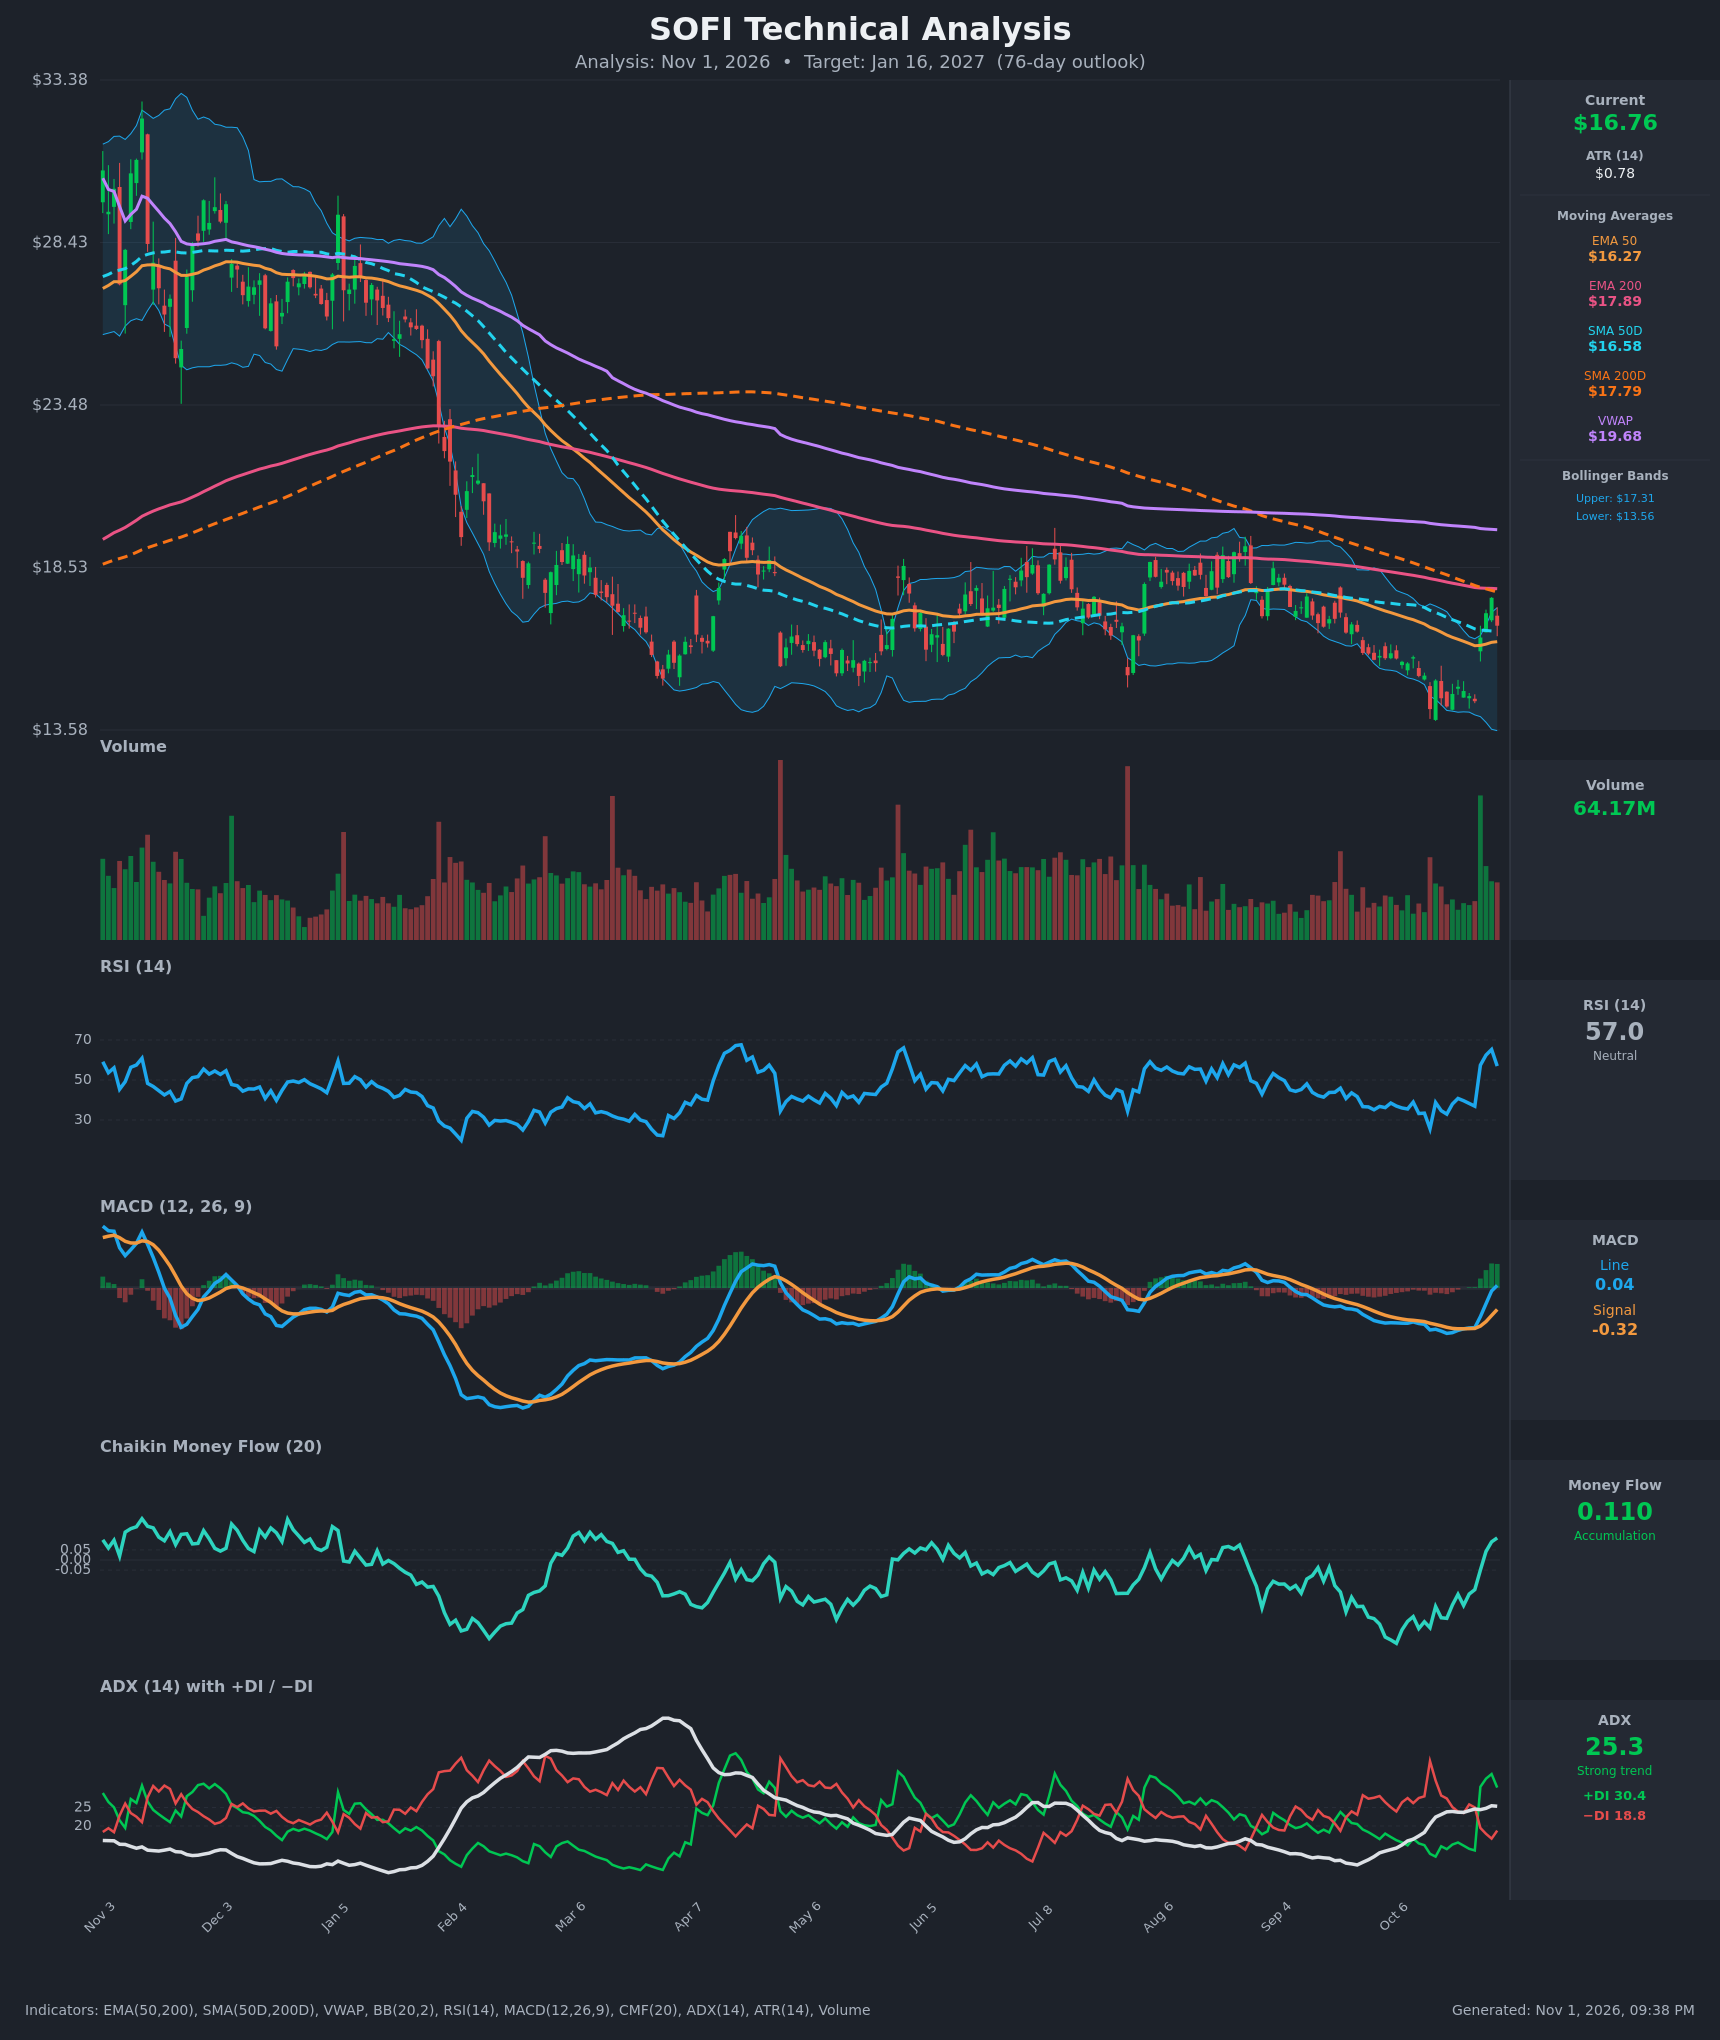
- RSI (14): 56.97, down from a 65.2 peak on Oct 29 but far above the 25.7 oversold low on Oct 14. Momentum has turned up from oversold into the upper-neutral zone, with room before 70. [Bullish]
- 20 EMA: The 20 EMA is not supplied, so I use the EMA 50 at $16.27 and the SMA 50D at $16.58. Price at $16.76 is above both, which now act as support after the Oct 27 gap-up. The EMA 200 ($17.89) and SMA 200D ($17.79) sit overhead as resistance. [Bullish]
- MACD: The line (0.038) crossed above the signal (-0.322) on Oct 30, and the histogram has turned positive and is expanding. The crossover happened near the zero line after a long bearish stretch. [Bullish]
- Bollinger Bands (20): The upper band is $17.31, the lower $13.56, and the midline is about $15.44. Price is in the upper half after rebounding from the lower band. The bands are wide, so volatility is elevated. The Oct 29 close of $17.61 poked above the upper band and was rejected, which is a minor short-term caution. [Bullish]
- CMF (20): 0.110, rising from -0.34 on Oct 12 to above the +0.05 threshold. This is a sharp swing from distribution to accumulation. [Accumulation]
- ADX (14): 25.3, rising, with +DI (30.4) well above −DI (18.8). The +DI/−DI crossover on Oct 27 flipped control to the bulls. The trend is just reaching "strong" status, but it is a young up-move inside a larger downtrend. [Strong Trend – Bullish]
- Volume: 64.17M, with a large green volume spike on the Oct 27 breakout bar, one of the biggest of the past year. Heavy volume on a reversal day signals institutional participation. The Oct 30 pullback came on lower volume than the breakout. [Bullish – accumulation on the breakout]
DIVERGENCES & TRENDS
- Price made lower lows into Oct 14–26 ($14.22–$14.46) while RSI held in the 33–40 range after its 25.7 flush. That is a mild positive RSI/price divergence leading into the reversal.
- CMF has turned up from deeply negative (-0.34) to +0.11, confirming buying pressure behind the bounce.
- The MACD bullish crossover came from below zero and has just reached the zero line. A sustained move above zero would confirm the trend change.
- Moving averages: The SMA 50D remains below the SMA 200D, and the EMA 50 below the EMA 200, so the death-cross regime is still in place and the long-term trend is still down. The gap is narrowing. Price is below the SMA 200D and the VWAP ($19.68), which is a structural headwind.
- The ADX base had been weak (17–18) during the pullback and has now risen above 25 with bullish DI control, which supports a regime shift.
CHART PATTERNS
- Bullish triple/double bottom (reversal): Lows at $14.22 (Oct 14), $14.30 (Oct 19) and $14.46 (Oct 26) form a flat support zone. The breakout above $15.2–$15.5 on Oct 27 resembles the triple-bottom/double-bottom reversal from the reference diagram. The measured move from the ~$14.30 floor to a neckline near $15.30 (about $1) points to roughly $16.3–$17.6, which is largely achieved.
- Bullish falling wedge / descending channel breakout: The decline from the spring through October traced a descending channel, and Oct 27 broke above its upper boundary. The wedge target is a retracement toward the start of the wedge, around $18.5–$19.5.
- Larger context: Since April, price has been basing in a roughly $14–$19 range after a 55% drop from the $33 area. Overhead resistance is the confluence of EMA 200 and SMA 200D near $17.8–$17.9, then $18.5 and $19.7 (VWAP).
POTENTIAL SCENARIOS
- Scenario 1: Bullish Reversal Continuation — Price holds the EMA 50/SMA 50 zone, then pushes through the EMA 200/SMA 200D confluence at about $17.9 on rising volume, with MACD above zero and CMF staying positive. Trigger: daily close above $17.90, with a first test of the $17.61 high. Target: $18.30–$19.00 (the wedge target and the VWAP area). Invalidation: close below $15.90, which loses the breakout gap and the 50-day averages. (50% probability)
- Scenario 2: Neutral Range Consolidation — Price stalls beneath the 200-day averages and chops between roughly $15.8 and $17.9 as the market digests the gap. Trigger: repeated rejections at $17.6–$17.9 with ADX fading below 20. Target: $16.2–$17.3. Invalidation: a break of either boundary on volume. (20% probability)
- Scenario 3: Bearish Failed Breakout — The rally proves to be a dead-cat bounce into the declining 200-day averages. Price loses the 50-day averages and fills the Oct 27 gap. Trigger: close below $16.27 (EMA 50) with a MACD recross lower. Target: $14.30–$15.00 (retest of the triple-bottom lows). Invalidation: a reclaim of $17.90. (30% probability)
PRICE TARGETS
- Target Price: $18.30 (76-day, Jan 16, 2027)
- Expected Range: $15.20 to $19.40 (width $4.20, about 25% of the current price, in line with the 61–180 day guidance)
- Key Levels: Support at $16.27 (EMA 50, with the $15.20 breakout zone below it), Resistance at $17.89 (EMA 200, with the SMA 200D at $17.79 alongside)
OVERALL BIAS
OVERALL BIAS: BULLISH - A high-volume breakout from a triple-bottom/falling-wedge base, a fresh MACD bullish crossover, CMF flipping to accumulation, and +DI control with ADX above 25 all support further upside. The main obstacle is the $17.8–$17.9 200-day average confluence, and the long-term death-cross regime keeps conviction modest.
This is educational analysis and not financial advice.