AMZN 97-day bearish forecast — Nov 1, 2026
- Bias: Bearish
- Timeframe: 97 days (made Nov 1, 2026, target date Feb 5, 2027)
- Price at analysis: $240.35
- Price target: $230.00
- Expected range: $203.00 – $259.00
- Result: Pending — graded after the close on Feb 5, 2027
Get a free AI analysis of AMZN today
Analysis
TECHNICAL INDICATORS
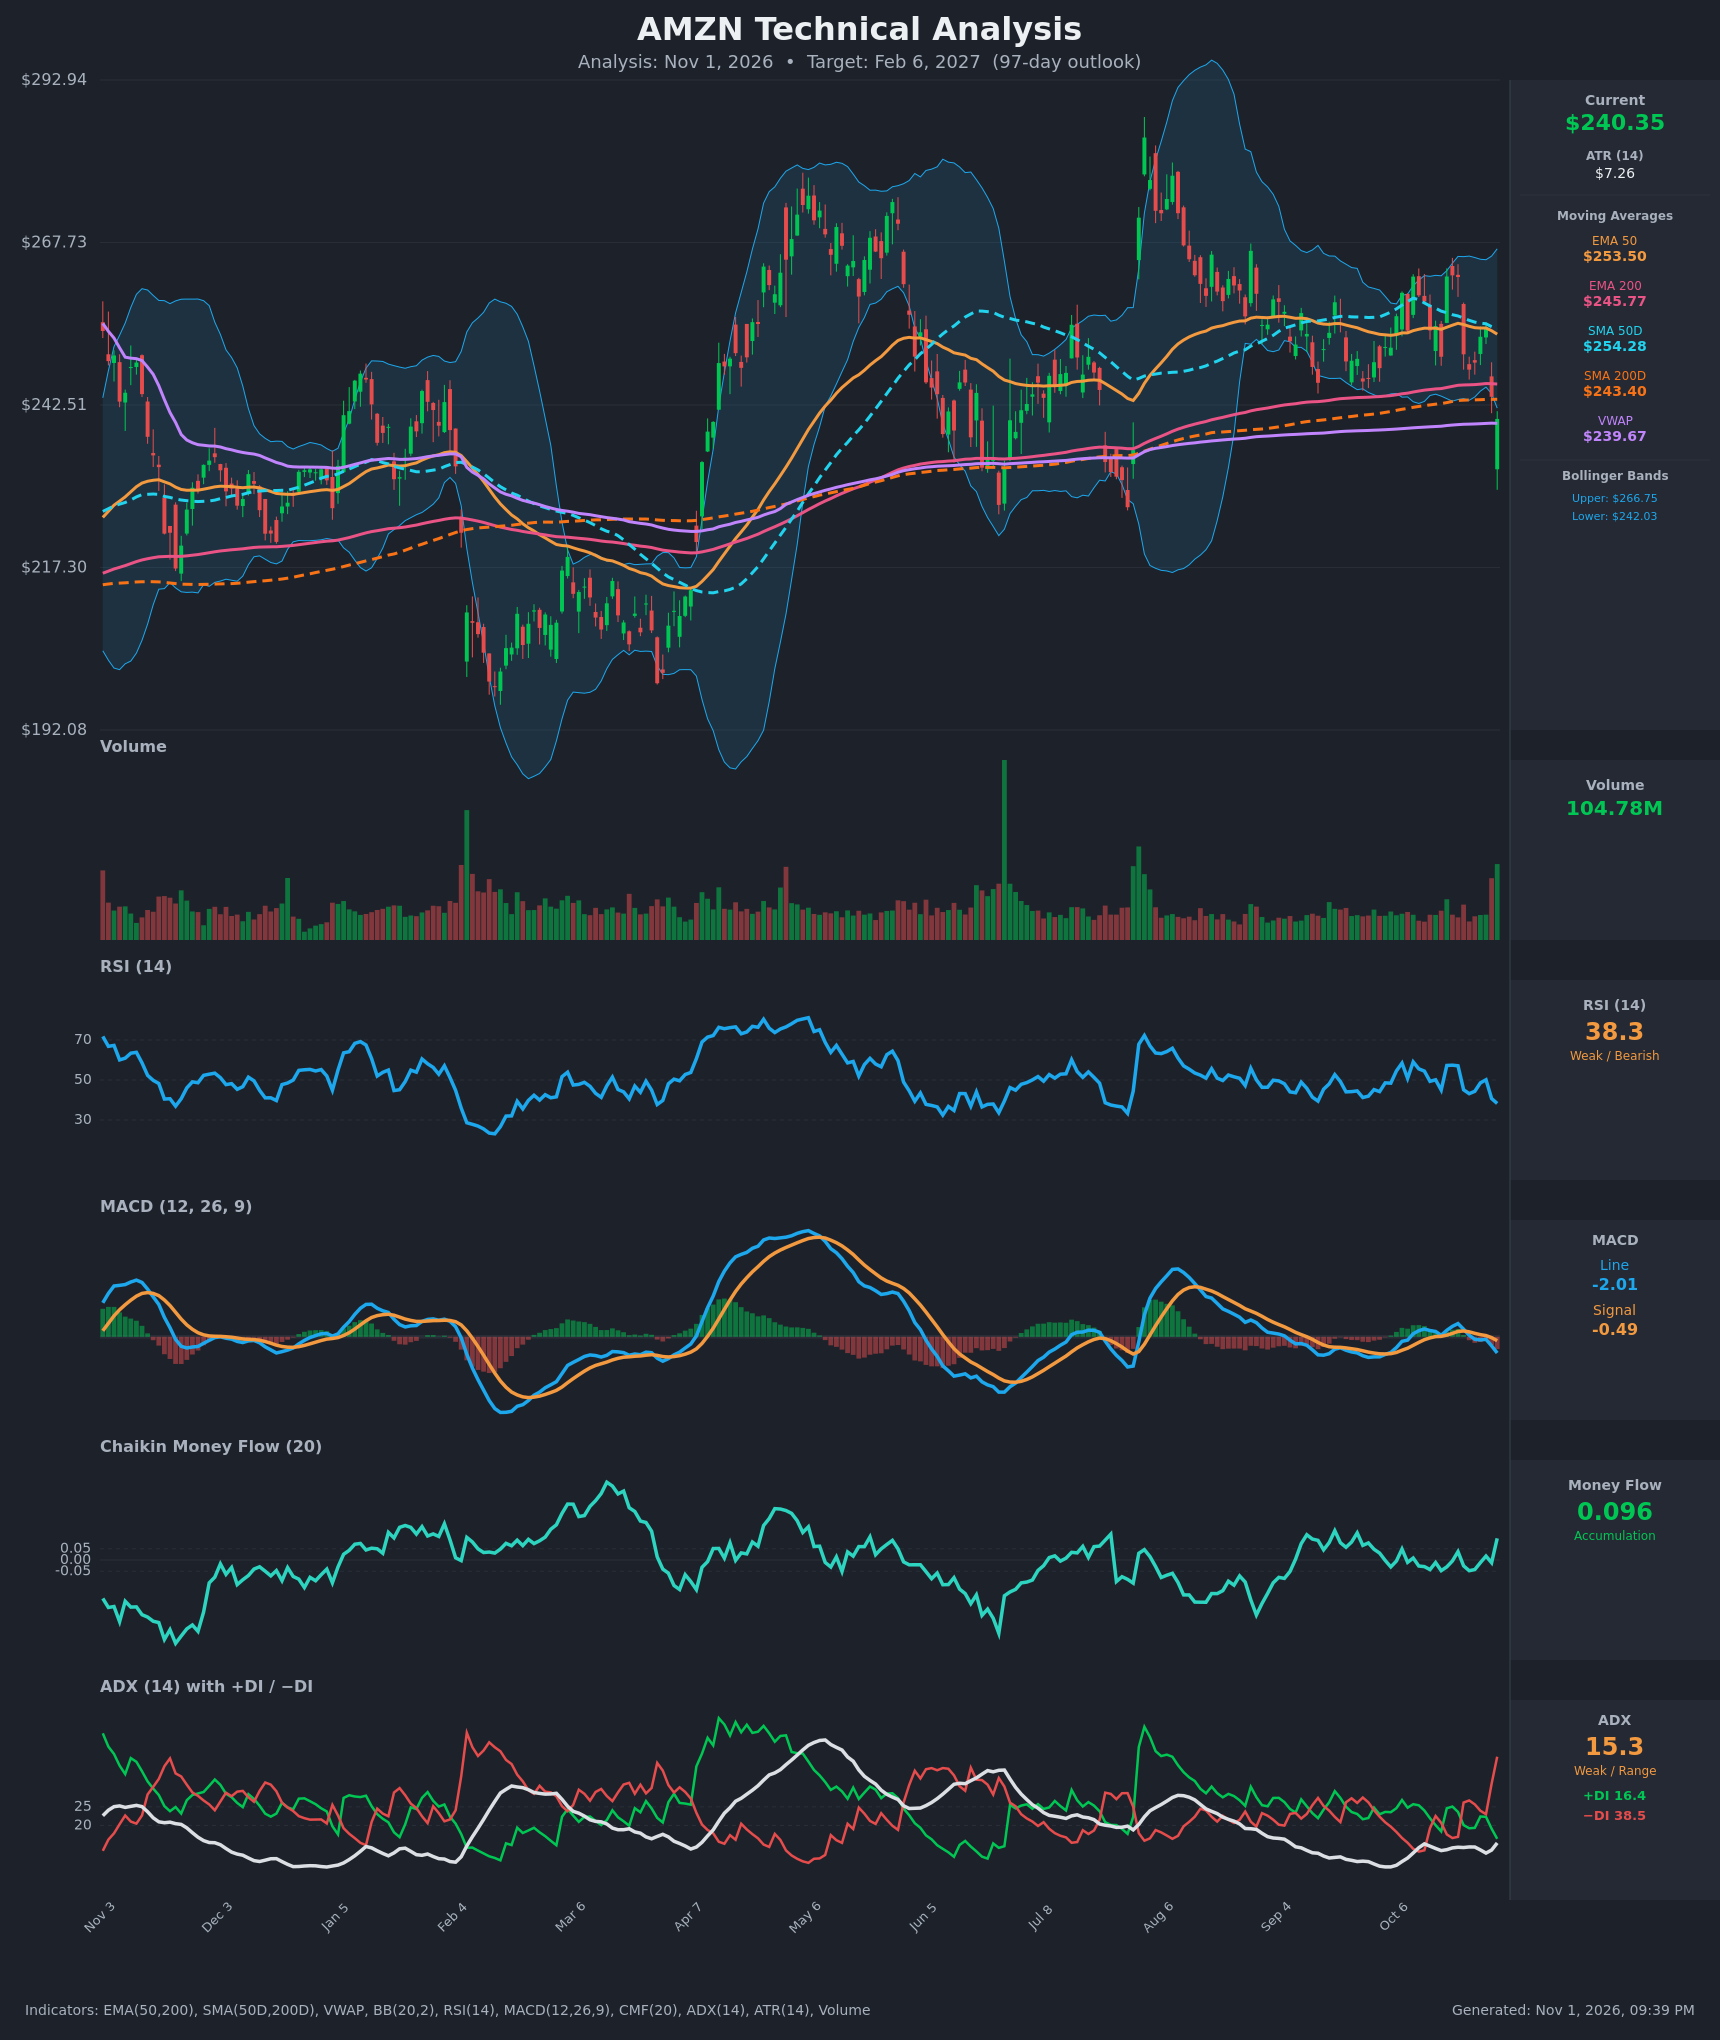
- RSI (14): 38.26, down from ~50 on Oct 28 and 57 on Oct 20-21. It is nearing oversold (30) but not there yet. Momentum is clearly falling, and the lower-high structure since the August spike is intact. [Bearish]
- 20 EMA: The 20 EMA is not supplied. Price at $240.35 sits well below the EMA 50 ($253.50), which acts as dynamic resistance. The 20 EMA is likely above price after the sharp drop from ~$254 to $240 in two sessions. [Bearish]
- MACD: Line -2.01 is below signal -0.49, giving a negative histogram of about -1.53. A bearish crossover occurred around Oct 29, and the line is accelerating below zero. [Bearish]
- Bollinger Bands (20): Upper $266.75, lower $242.03. Price at $240.35 is below the lower band after a sharp breakdown from the middle (~$254). This shows short-term stretched selling and raises odds of a mean-reversion bounce, but the bands are fairly wide and a close below the band after a gap-down is a momentum signal. [Bearish]
- CMF (20): 0.096, above the +0.05 threshold and up from -0.012 the prior day. Volume-weighted closes still show accumulation, which conflicts with the price drop. The reading may reflect the heavy-volume final bar closing off its lows. [Accumulation]
- ADX (14): 15.3 (weak, range-bound), but rising from 12.6. −DI at 38.5 is far above +DI at 16.4, and the DI spread is widening sharply. Bears are in control of the current thrust, though the trend is not yet established. [Weak Trend, Bearish direction]
- Volume: 104.78M, the highest bar in months apart from the earlier spikes, on a red gap-down candle. High volume on a decline points to distribution or an event-driven repricing. It can also mark a capitulation-type flush. [Bearish]
DIVERGENCES & TRENDS
- Price vs. CMF: CMF turned up to +0.096 while price fell to a new local low. This is a mild bullish divergence, but it is a single-bar signal and not yet reliable.
- RSI/MACD: Both are making lower highs since the Oct 20-21 peak, in line with price. No bullish divergence.
- Moving averages: Price is below EMA 50 ($253.50) and SMA 50D ($254.28) but still just below EMA 200 ($245.77) and SMA 200D ($243.40). It is testing that long-term support zone. The EMA 50 / EMA 200 gap (~$7.7) is narrowing as the 50s roll over. A bearish cross of the 50s under the 200s is possible in the coming weeks, while the SMA 50D is still above the SMA 200D, so no death cross yet.
- VWAP: Price ($240.35) is just above VWAP ($239.67), so VWAP is immediate support. A break below would add pressure.
- Trend: Since the August spike, the stock has made lower highs and has ranged in roughly $243-$265. This breakdown from the range's lower edge is the key development.
- DI: −DI crossed above +DI on Oct 15, again on Oct 22, and has since widened sharply. Bearish control is expanding.
CHART PATTERNS
- Range with a breakdown: Since August the stock has traded in a rough rectangle, with resistance near $262-266 (multiple rejections at the upper Bollinger Band) and support near $243-248. The latest bar closes below that support. This resembles a Bearish Triple Top (highs at ~$262-263 on Oct 19-21, plus earlier highs). The measured move is the range height (~$20) projected down from ~$245, giving about $225.
- Descending/lower-high structure: Peaks of ~$285 (Aug), ~$265 (Sep), and ~$263 (Oct) form a descending resistance line, similar to a Descending Triangle. A break of the flat support near $243 targets the same area, $222-$228.
- Caveat: The SMA 200D at $243.40 and the EMA 200 at $245.77 form a support cluster. The prior Nov-Dec and Jul-Aug consolidations are also reference zones. A failed breakdown would produce a bullish reversal (bear trap), but the evidence currently favors the downside.
POTENTIAL SCENARIOS
- Scenario 1: Bearish Range Breakdown Continuation — Price loses the 200-day cluster and VWAP, with −DI dominant and MACD negative, and drifts toward the pattern target and the $217-$225 prior support zone. Trigger: daily close below $236 (below VWAP and the 200-day cluster). Target: $222-$228, extended to ~$217. Invalidation: daily close back above $254 (EMA 50/SMA 50D). (50% probability)
- Scenario 2: Neutral Choppy Recovery Back Into Range — A bounce from the lower Bollinger Band and the CMF-supported accumulation pull price back to $245-$255, then it stalls under the 50-day averages. Trigger: reclaim of $246 (EMA 200) on volume. Target: $248-$255. Invalidation: close below $235. (28% probability)
- Scenario 3: Bullish Bear-Trap Reversal — The breakdown fails, the 200-day cluster holds, and buyers push through the 50s and the range top, which opens the $265-$275 area. Trigger: close above $255 with RSI >55 and MACD crossing up. Target: $265-$275. Invalidation: close below $232. (22% probability)
PRICE TARGETS
Timeframe: 97 days (Feb 6, 2027). The range width must be ~18-30% of price; mine is ~$56 ≈ 23.3%.
- Target Price: $230.00 (modest downside bias from the breakdown and the descending pattern, tempered by the 200-day support and CMF accumulation)
- Expected Range: $203.00 to $259.00 (width $56 ≈ 23.3% of current price)
- Key Levels: Support at $236.00 (then $222), Resistance at $246.00 (EMA 200; then $254)
OVERALL BIAS
OVERALL BIAS: BEARISH - Price has broken below the lower Bollinger Band and the Aug-Oct range with −DI far above +DI, a negative MACD cross, falling RSI, and a heavy-volume red bar. The descending lower-high structure points to a measured move toward the mid-$220s, despite supportive CMF and the nearby 200-day cluster.
This is educational analysis and not financial advice.