XLF 76-day bullish forecast — Nov 1, 2026
- Bias: Bullish
- Timeframe: 76 days (made Nov 1, 2026, target date Jan 15, 2027)
- Price at analysis: $56.51
- Price target: $58.30
- Expected range: $51.50 – $62.00
- Result: Pending — graded after the close on Jan 15, 2027
Get a free AI analysis of XLF today
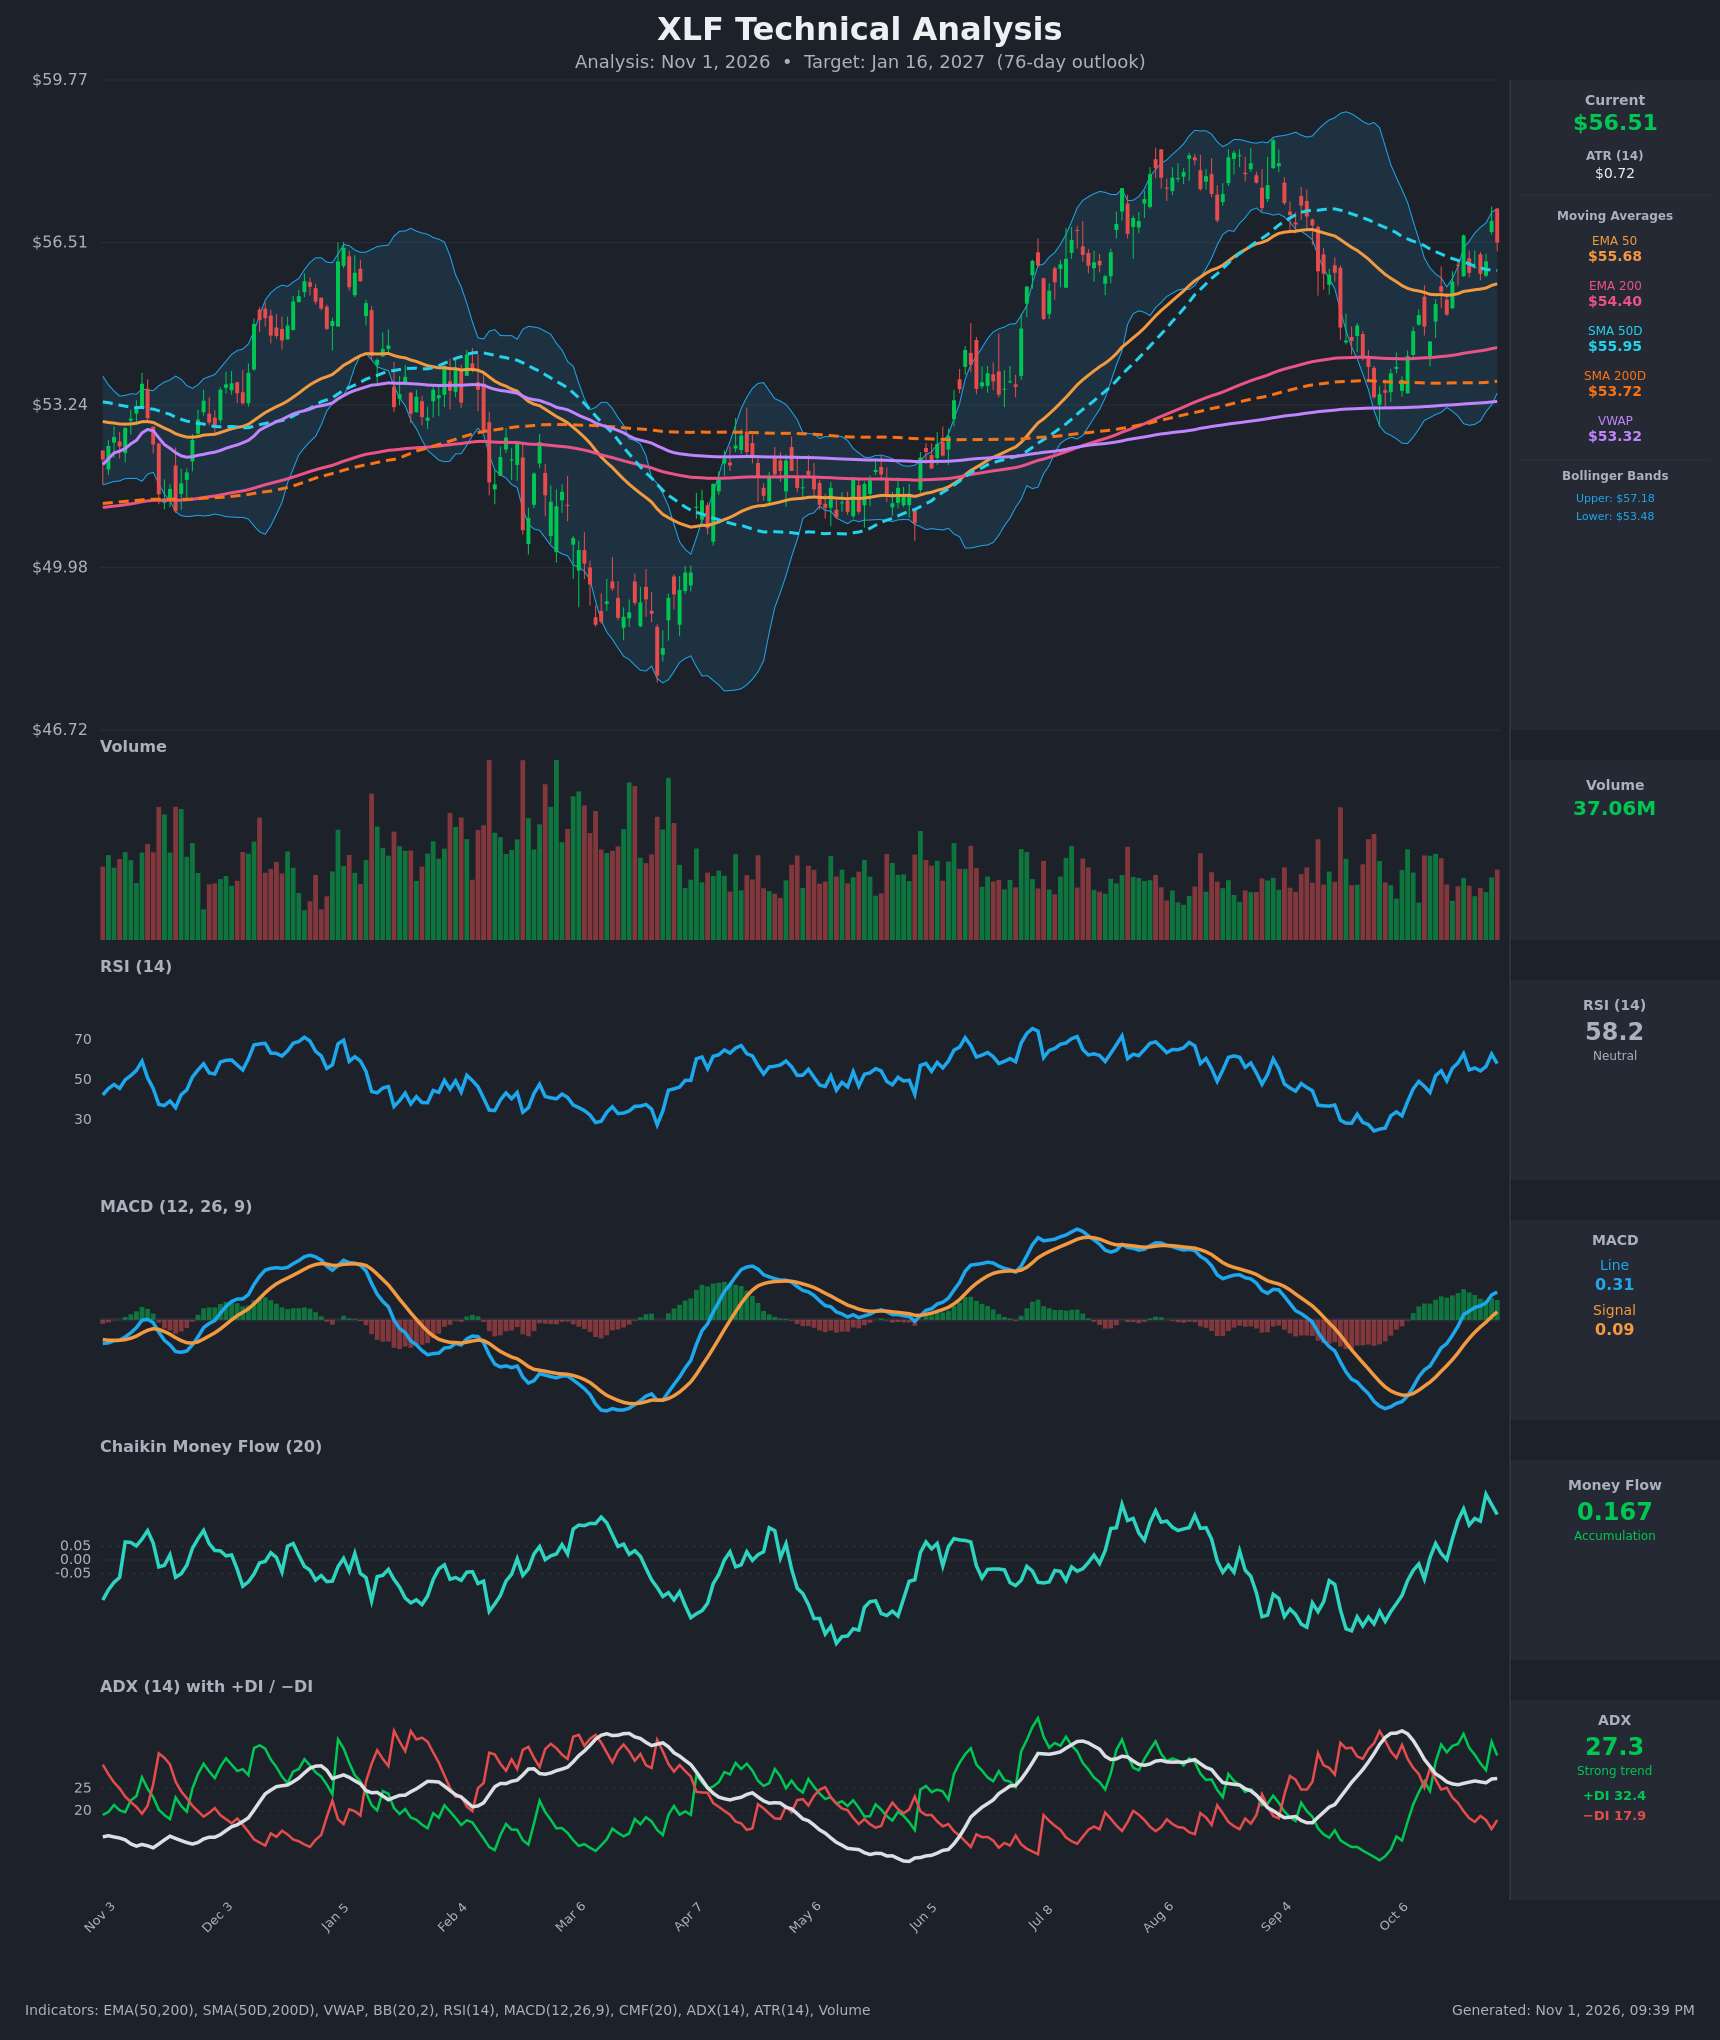
Analysis
TECHNICAL INDICATORS
- RSI (14): 58.19, down from 63 on Oct 29 but well above the 43.8 low on Oct 14. It is neutral-to-positive, with room before overbought (70). Momentum has recovered from the oversold zone in late September. [Bullish]
- 20 EMA: Not supplied, so I use the EMA 50 at $55.68 as a proxy. Price at $56.51 is above it, and the EMA 50 is above the EMA 200 ($54.40) and rising. The ~$55.5-55.7 zone is the first support. [Bullish]
- MACD: Line 0.306 is above signal 0.088. It crossed up on Oct 29 and the histogram is positive and widening. The line is still near the zero line, so this is an early-stage momentum shift. [Bullish]
- Bollinger Bands (20): Upper $57.18 and lower $53.48, so price sits in the upper half, about 80% of the band width. The bands have expanded after the September low. There is no squeeze, and the upper band is near-term resistance. [Bullish]
- CMF (20): 0.167, well above +0.05 and near the highest level of the year. It has been positive for 10+ sessions, which shows genuine accumulation. [Accumulation]
- ADX (14): 27.3 with +DI 32.4 above −DI 17.9. The trend is strong and bulls control. ADX has been flat in the 26-27 range while the DI spread is widening. [Strong Trend + Bullish]
- Volume: 37.06M, about average and without a spike. The recent up days carry decent volume, but there is no breakout surge yet. [Neutral-to-Mildly Supportive]
DIVERGENCES & TRENDS
- No bearish RSI or MACD divergence. Price is making higher lows since the late-September trough (~$53.4) and the indicators confirm.
- Moving averages: price ($56.51) is above the EMA 50 ($55.68), SMA 50 ($55.95), EMA 200 ($54.40), SMA 200 ($53.72) and VWAP ($53.32). The EMA 50 is above the EMA 200, a standing bullish alignment.
- SMA 50 ($55.95) is above SMA 200 ($53.72), so the golden cross is already in place. The SMA 50 has been sloping down since mid-October and is converging with price, so it is a pullback-support zone that price has now cleared.
- MACD bullish crossover on Oct 29 and CMF at a yearly high. The +DI/−DI crossover happened on Oct 15, with the spread widening since.
- Price is approaching the July-August highs near $58.5-59.5, which is major overhead resistance.
CHART PATTERNS
- Bullish Double Bottom / Inverted-style base: The late-September low (~$53.4) followed by a rally above the 50-day averages resembles a V-shaped recovery inside a larger range. Price has reclaimed the middle of the 12-month range.
- Bearish Double Top risk (reference): The July-August peak (~$58.5-59.5) is a potential top. Price would need to revisit that area and fail to confirm this, so it is a watch item rather than an active pattern.
- Overall, the structure is a recovery uptrend inside a wide range. A measured move from the base (~$53.4 to the $56.5 area) would point to roughly $58.5-59.5, matching prior highs.
POTENTIAL SCENARIOS
- Scenario 1: Bullish Trend Continuation to Prior Highs — The accumulation (CMF 0.167), MACD crossover and strong ADX carry price up toward the summer highs. Trigger: close above $57.20 (upper Bollinger Band) on rising volume. Target: $58.80-59.50. Invalidation: close below $55.00. (50% probability)
- Scenario 2: Neutral Range Consolidation — Price stalls beneath $57-57.5 and chops between the $55.5 support area and $57.5. Trigger: failure to break $57.20 with fading volume. Target: $55.50-57.50. Invalidation: close above $57.5 or below $55.0. (28% probability)
- Scenario 3: Bearish Pullback and Failed Rally — Price rejects the upper band and rolls over, losing the EMA 50 and SMA 50 cluster. Trigger: close below $55.60 with MACD crossing back below signal. Target: $53.50-54.40. Invalidation: reclaim of $57.20. (22% probability)
PRICE TARGETS
For a 76-day timeframe, the range width should be ~18-30% of the current price. The Expected Range of $52.50 to $60.00 is $7.50 wide, about 13.3%, which is too narrow for this timeframe. I widen it to $51.80 to $61.20, a width of $9.40 (16.6%), and then to $51.50 to $62.00, a width of $10.50 (18.6%), which fits the guidance.
- Target Price: $58.30 (76 days from now)
- Expected Range: $51.50 to $62.00 (width $10.50, about 18.6%)
- Key Levels: Support at $55.68, Resistance at $57.18
OVERALL BIAS
OVERALL BIAS: BULLISH - Price is above all key moving averages, with a fresh MACD bullish crossover, strong ADX with +DI dominant, and CMF at a yearly-high accumulation reading. Prior highs near $58.5-59.5 are the natural 76-day objective, though resistance near $57.2 may slow progress.
This is educational analysis and not financial advice.