CRWV 97-day bearish forecast — Nov 1, 2026
- Bias: Bearish
- Timeframe: 97 days (made Nov 1, 2026, target date Feb 5, 2027)
- Price at analysis: $54.87
- Price target: $49.50
- Expected range: $43.00 – $58.00
- Result: Pending — graded after the close on Feb 5, 2027
Get a free AI analysis of CRWV today
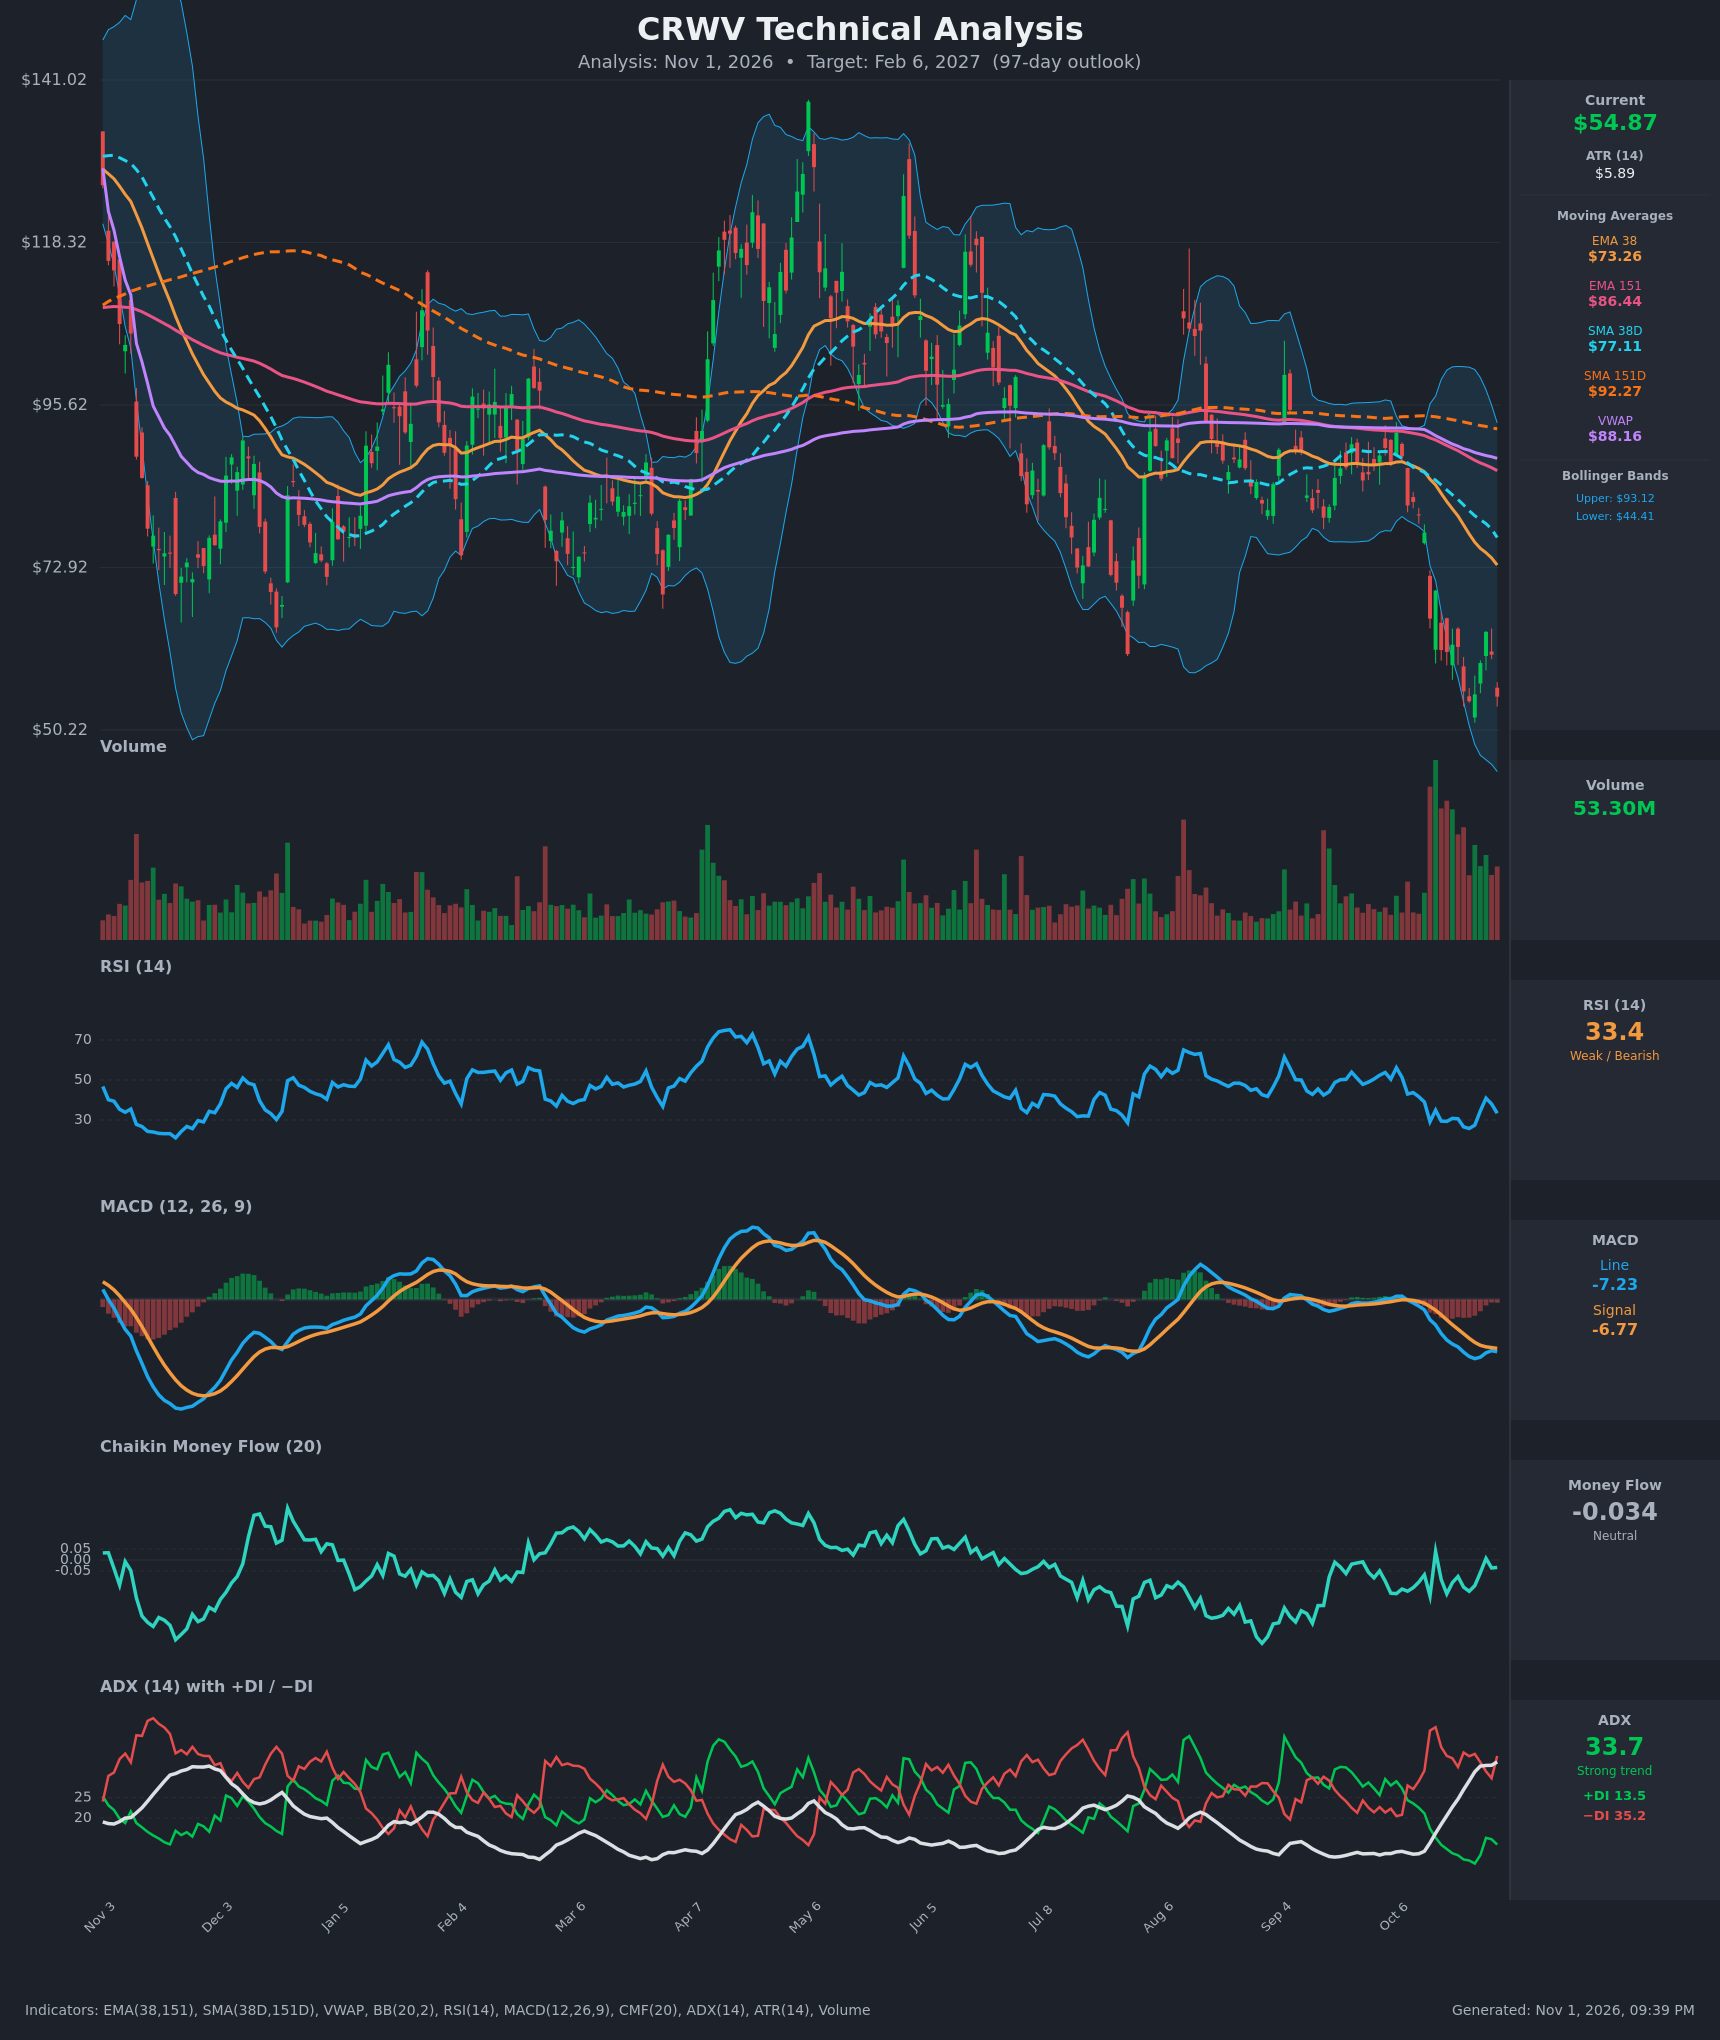
Analysis
TECHNICAL INDICATORS
- RSI (14): 33.36, just above oversold. It has been in a 25–41 band for two weeks. The Oct 28 bounce to 40.9 failed, and RSI is rolling over again with lower highs. [Bearish]
- 20 EMA (EMA 38 / EMA 151 supplied): EMA 38 is $73.26 and EMA 151 is $86.44. Price at $54.87 is about 25% below EMA 38. Both EMAs are falling and EMA 38 is below EMA 151, so overhead moving averages act as resistance. [Bearish]
- MACD: Line -7.23 is below signal -6.77, with a small negative histogram. Both lines are deeply negative. The Oct 27–29 bounce narrowed the gap, but the line is now turning down again. [Bearish]
- Bollinger Bands (20): Upper $93.12, lower $44.41. Price is in the lower half, about 22% of the way up the band, and has not touched the lower band. The bands are wide after the breakdown, so volatility is expanding. A band walk lower remains possible. [Bearish]
- CMF (20): -0.034, inside the neutral zone (±0.05). It has oscillated around zero with no real accumulation during the decline. That is mildly negative and not confirming a capitulation low. [Neutral]
- ADX (14): 33.7 and rising from 11 on Oct 12, with −DI 35.2 far above +DI 13.5. This is a strong, fresh downtrend with bears firmly in control. [Strong Trend – Bearish]
- Volume: 53.30M, the highest in the chart window. The selling was heavy on the breakdown from ~$80 to ~$55, which points to genuine distribution and not a quiet drift. The recent bounces came on lower volume. [Bearish – heavy-volume breakdown]
DIVERGENCES & TRENDS
- No bullish RSI or MACD divergence. Price made a lower low on Oct 30 ($54.87 vs $54.23 close on Oct 23 is roughly equal), while RSI at 33.4 is above its Oct 23 low of 25.8. This is a mild bullish RSI divergence, but it is weak and unconfirmed.
- A death cross is already in place: SMA38D ($77.11) is below SMA151D ($92.27), and EMA 38 is below EMA 151. Price is well below SMA151D, which confirms a long-term downtrend.
- The ADX breakout above 25 with −DI dominant shows trend strength is building, not exhausting.
- Price is below VWAP ($88.16) by roughly 38%, which marks a sustained seller-controlled market.
- The gap between price and the 38-period averages is stretched, which raises the odds of a relief bounce. That bounce would be a rally within the downtrend unless price reclaims ~$64–73.
CHART PATTERNS
- Breakdown from a wide range, continuation lower: Price lost the $85–95 consolidation shelf, where the moving averages converged, and fell hard. This is bearish continuation, resembling a descending-triangle/range breakdown.
- Bearish flag/pennant (small): The bounce from $54 to ~$64 with lower highs resembles a bearish flag on lighter volume. Failure at ~$64 and a break of $54 would project a measured move toward the mid-$40s, near the lower Bollinger Band.
- Possible Bullish Double Bottom (low confidence): Closes at ~$54.23 (Oct 23) and ~$54.87 (Oct 30) form a potential double bottom around $54–55 with a neckline near $64. It is not valid until price closes above ~$64, and it fails on a break below $54.
POTENTIAL SCENARIOS
- Scenario 1: Bearish Trend Continuation — Price breaks the $54 double-bottom support, and the strong ADX and −DI dominance extend the decline toward the lower band. Trigger: daily close below $54.00 on elevated volume. Target: $44–50, with a 97-day target around $49.50. Invalidation: daily close above $64 (the recent swing high). (50% probability)
- Scenario 2: Bullish Relief Rally / Double Bottom — Oversold conditions and the mild RSI divergence produce a double-bottom bounce toward the falling EMA 38. Trigger: close above $64 with CMF moving above +0.05. Target: $73–77 (EMA 38 / SMA38D). Invalidation: close below $50. (30% probability)
- Scenario 3: Neutral Basing Range — Price stabilizes between $48 and $64 as volatility contracts after the selloff. Trigger: ADX rolls over from 34 and volume fades. Target: $52–60. Invalidation: close outside $48–64. (20% probability)
PRICE TARGETS
- Target Price: $49.50 (97 days, Feb 6, 2027)
- Expected Range: $43.00 to $58.00 (width $15.00, about 27% of current price, consistent with the 61–180 day guidance)
- Key Levels: Support at $50.22, Resistance at $63.93
OVERALL BIAS
OVERALL BIAS: BEARISH - Price is in a strong, high-volume downtrend (ADX 33.7, −DI 35.2 vs +DI 13.5). It trades below every moving average and VWAP, with a death cross and bearish MACD. The RSI divergence and potential double bottom at $54 are not enough to override trend, so continued weakness toward the high-$40s is the most likely path.
This is educational analysis and not financial advice.