AMD 97-day bearish forecast — Nov 1, 2026
- Bias: Bearish
- Timeframe: 97 days (made Nov 1, 2026, target date Feb 5, 2027)
- Price at analysis: $504.80
- Price target: $478.00
- Expected range: $425.00 – $565.00
- Result: Pending — graded after the close on Feb 5, 2027
Get a free AI analysis of AMD today
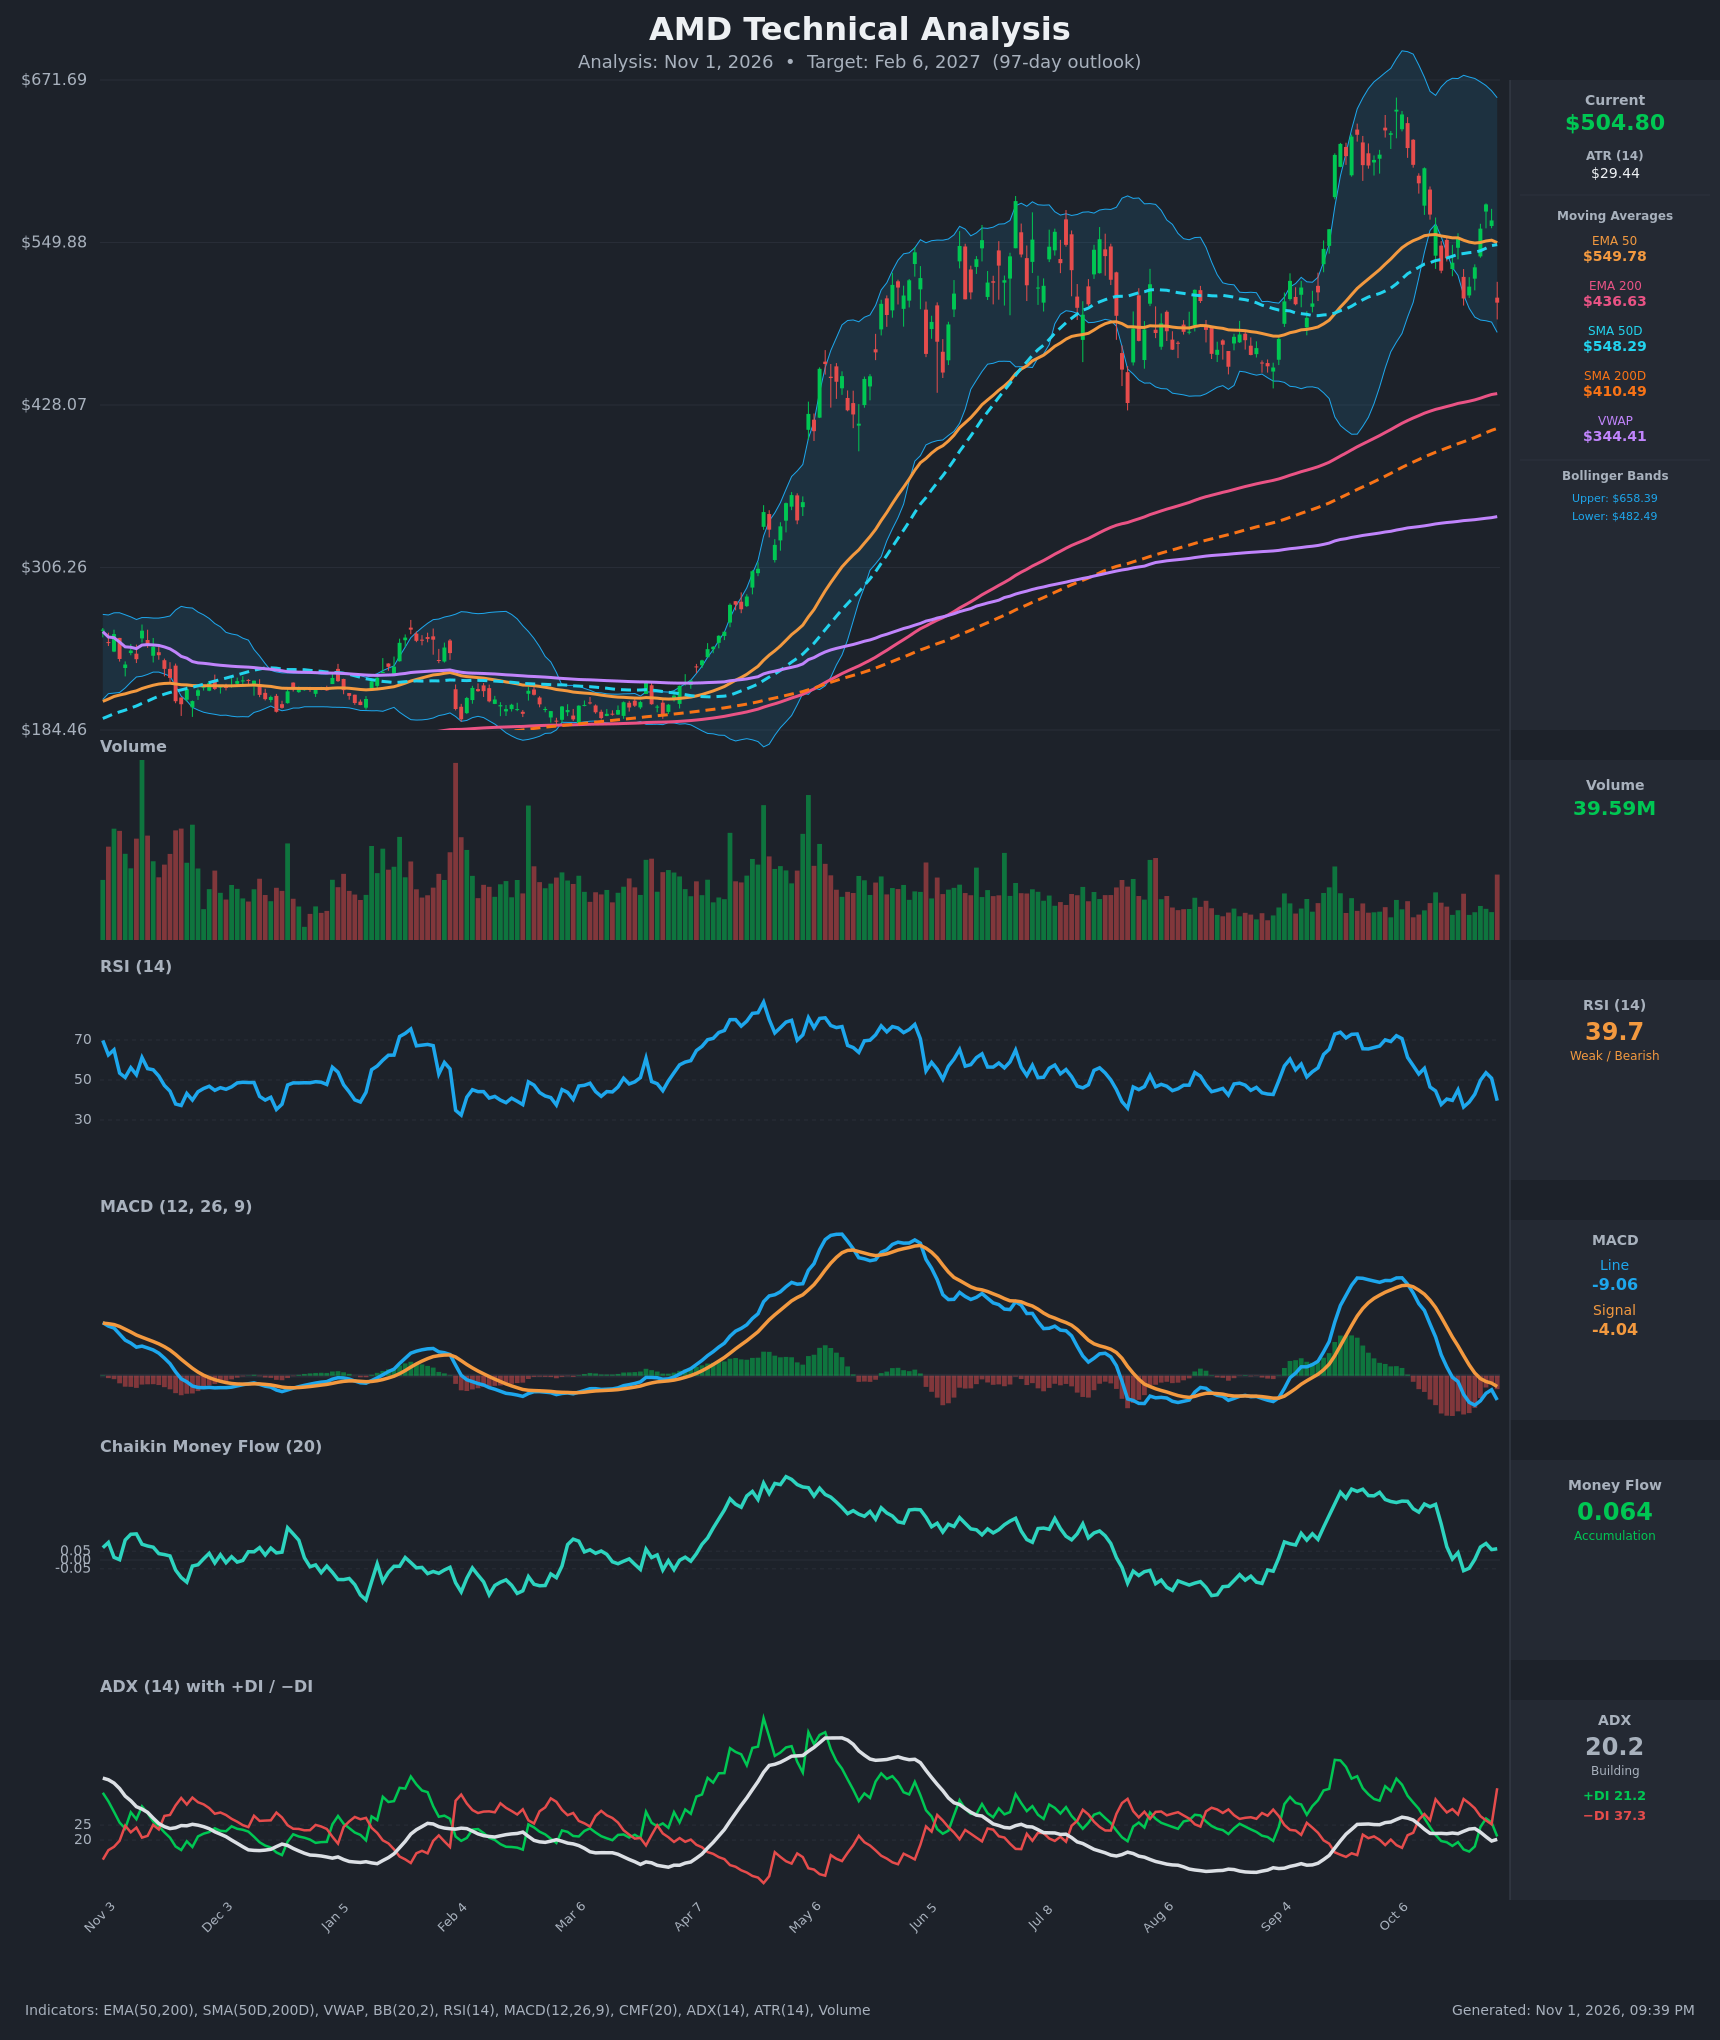
Analysis
TECHNICAL INDICATORS
- RSI (14): 39.67, down sharply from 50.9 on Oct 29. It is in the weak zone but not oversold (<30). Momentum is falling, and the chart shows lower RSI peaks (about 53 → 54) since the September high. [Bearish]
- 20 EMA: No 20 EMA is plotted or supplied. The EMA 50 ($549.78) and SMA 50D ($548.29) are the nearest dynamic references, and price at $504.80 is about 8% below both. They now act as overhead resistance, and the Oct 30 close lost them decisively after a rejection near $578. [Bearish]
- MACD: Line -9.06 is below Signal -4.04, and both are below zero. The line crossed below the signal in late Oct and crossed below zero on Oct 20. The histogram is negative and widened again on the latest bar, so momentum is bearish. [Bearish]
- Bollinger Bands (20): Upper $658.40, lower $482.49, so the bands are very wide after the spike to about $650. Price at $504.80 is in the lower third, about $22 above the lower band, and it is not a squeeze. The move from the upper half to near the lower band in two days shows momentum shifting down. A band-walk or close below $482 would be a bearish continuation signal. [Bearish]
- CMF (20): 0.064, only just above the +0.05 threshold. It has faded from 0.318 on Oct 13, and the last bar was a heavy-volume red candle, so accumulation is weakening. [Neutral]
- ADX (14): 20.2 with −DI 37.3 above +DI 21.2. ADX is at the border of a weak trend, but the DI spread is wide (16 points) and −DI just jumped from 25 to 37, so bears control direction. An ADX rise above 25 would confirm a downtrend. [Weak Trend, Bearish direction]
- Volume: 39.59M on the Oct 30 red candle, the highest volume in several weeks (recent bars were mostly below average). A -10.9% drop on expanding volume signals distribution or a shock sell-off rather than a quiet pullback. [Bearish]
DIVERGENCES & TRENDS
- Trend structure: The long-term trend is up. Price is above the EMA 200 ($436.63) and SMA 200D ($410.49), and the golden cross is intact with SMA 50D well above SMA 200D. Price is about 23% above the SMA 200D and VWAP ($344.41), so it is extended relative to long-term averages.
- Failed breakout: The rally from the $430 zone to about $650 in Sep–Oct reversed fully. Price has given back the entire move and sits below the 50-day averages, which suggests a bull trap.
- MACD and RSI: Both made lower highs versus the spring peak, and MACD is now negative. Both are bearish but not oversold, so there is room to fall.
- DI crossover: −DI crossed above +DI on Oct 13–15 and has stayed there. It widened on Oct 30.
- Price vs EMA 50: Price recently crossed below the EMA 50 and SMA 50D (Oct 30), a short-term bearish break. The EMA 50 at $549.78 is flat to slightly falling.
- No bullish divergence: RSI and price are both making lower lows, so there is no early reversal signal.
CHART PATTERNS
- Broad consolidation and failed breakout: From June to September price chopped between about $430 and $560 (roughly a Bearish Triple Top / rectangle on the $550–560 ceiling). The Sep–Oct breakout to $650 failed, which resembles a Bearish Expanding Triangle, with a higher high followed by a drop back into the range. The measured implication is a rotation back toward the range middle or low ($430–$480).
- Support zones: $482 (lower Bollinger Band), $460–$470 (September swing lows), and $437 (EMA 200). A decisive break below about $430 would negate the long-term uptrend structure.
- Counter-pattern: A Bullish Pennant/Flag is not visible. The long-term uptrend could still make this a deep pullback within the larger range, which is why the bearish call is only modest.
POTENTIAL SCENARIOS
- Scenario 1: Bearish Range Rotation Lower — Failed breakout and negative momentum drag price back to the lower part of the 2025–26 range and toward the EMA 200. Trigger: daily close below $482.49 (lower BB) with MACD staying negative and ADX rising above 25. Target: $460, then $437–$425. Invalidation: daily close back above $550 (EMA 50/SMA 50D). (45% probability)
- Scenario 2: Bullish Reclaim and Recovery — The Oct 30 flush holds the $482 band and long-term support, and price recovers on the uptrend and mildly positive CMF. Trigger: close above $550 with MACD crossing back above the signal line. Target: $575–$600, with an extension to $650. Invalidation: close below $460. (35% probability)
- Scenario 3: Neutral Choppy Base — Price oscillates between about $460 and $550 for months as it digests the volatility, with weak ADX. Trigger: repeated rejections at $550 and bounces at $470. Target: $490–$520. Invalidation: close outside $440–$575. (20% probability)
PRICE TARGETS
- Target Price: $478.00 (97-day horizon, Feb 6, 2027)
- Expected Range: $425.00 to $565.00 (width $140 ≈ 27.7% of current price, in line with the 61–180 day guidance)
- Key Levels: Support at $482.49, Resistance at $549.78
OVERALL BIAS
OVERALL BIAS: BEARISH - Price lost the EMA 50 and SMA 50D on a -10.9% heavy-volume day, with a bearish MACD, −DI dominating (37.3 vs 21.2), and a failed breakout above $600. The long-term uptrend above the 200-day averages limits downside, so I expect a drift toward the $430–$480 zone rather than a collapse.
This is educational analysis and not financial advice.