DELL 97-day bearish forecast — Nov 1, 2026
- Bias: Bearish
- Timeframe: 97 days (made Nov 1, 2026, target date Feb 5, 2027)
- Price at analysis: $424.30
- Price target: $385.00
- Expected range: $335.00 – $440.00
- Result: Pending — graded after the close on Feb 5, 2027
Get a free AI analysis of DELL today
Analysis
TECHNICAL INDICATORS
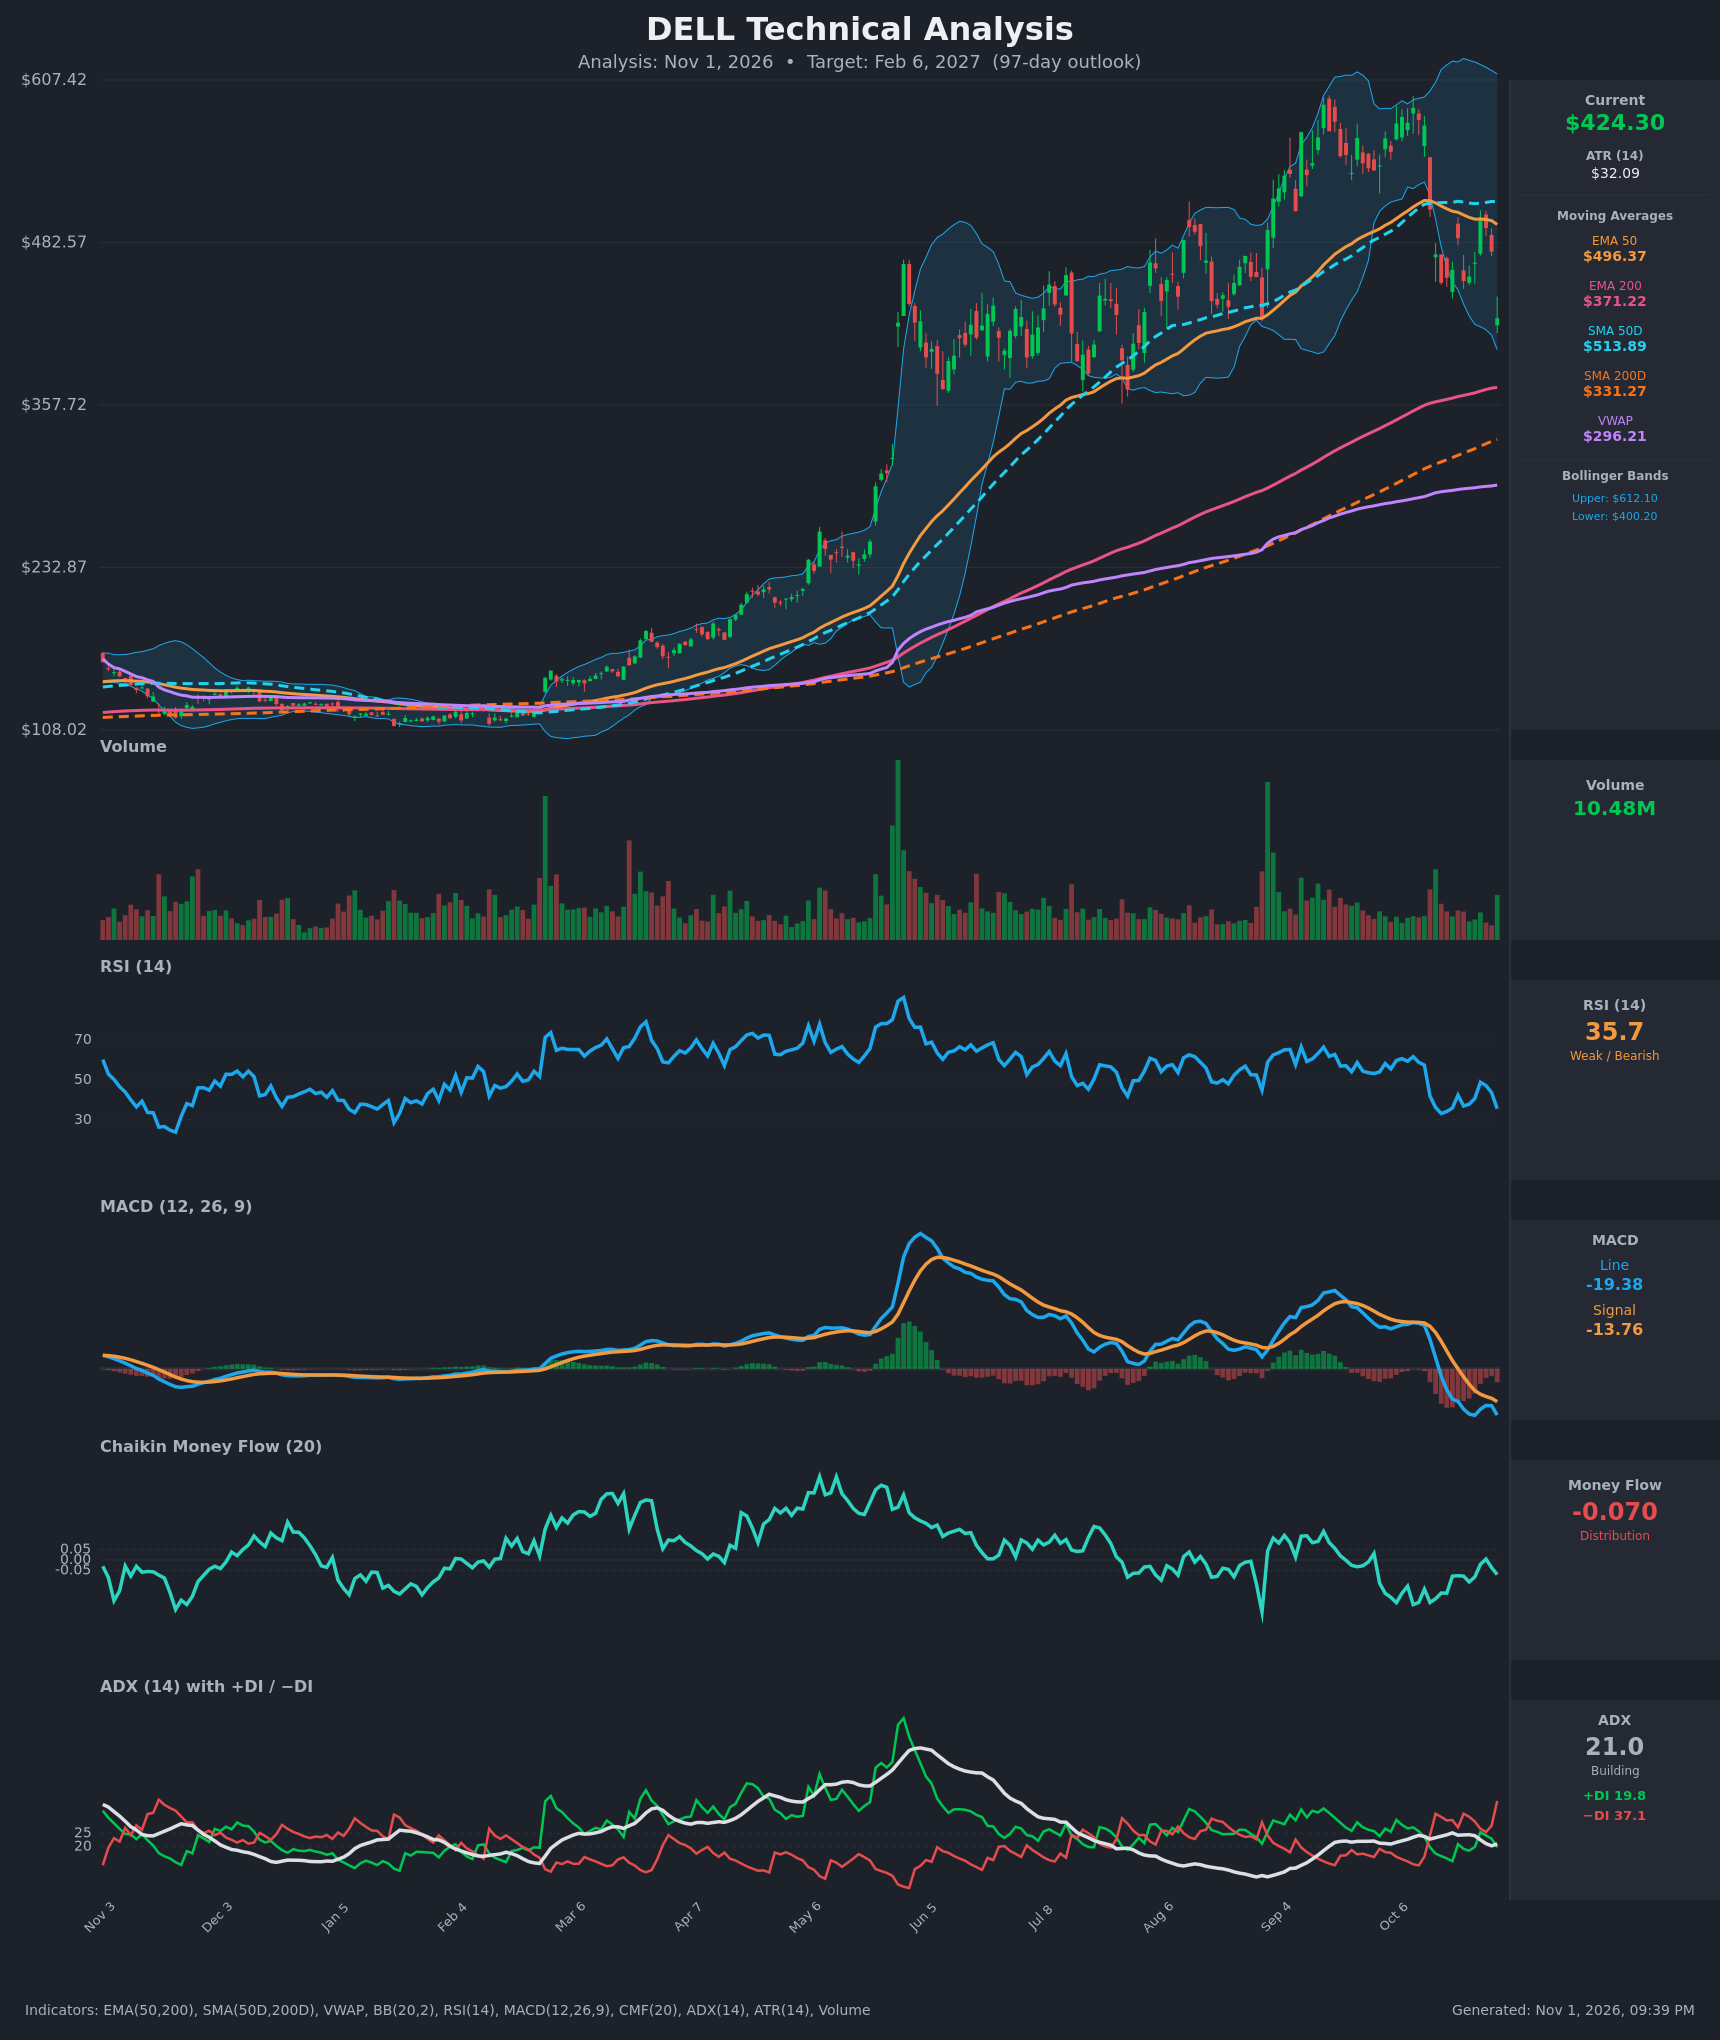
- RSI (14): 35.65, down from 58.8 on Oct 12 and 48.9 on Oct 27. It is near but not yet oversold (<30). Each bounce has failed at progressively lower RSI levels, so momentum is weak and still falling. [Bearish]
- 20 EMA: No 20 EMA value was supplied. The Bollinger midline (20-period average) sits at about $506, and price at $424.30 is roughly 16% below it. The EMA50 ($496.37) and SMA50D ($513.89) are also overhead, so all short and intermediate averages act as resistance. [Bearish]
- MACD: Line -19.39 is below signal -13.76, a bearish crossover that occurred around Oct 21. Both lines are below zero and the histogram is negative and widening. The Oct 27-29 bounce did not close the gap. [Bearish]
- Bollinger Bands (20): Upper $612.10, lower $400.20, so the bands are very wide after the volatile run to about $580. Price is in the lower third of the bands, below the midline and about $24 above the lower band. The band walk down and widening suggest elevated volatility and continued downside pressure. A bounce from the lower band is possible. [Bearish]
- CMF (20): -0.070 is below the -0.05 threshold. It briefly touched +0.005 on Oct 28 but rolled over again, so there is no sustained accumulation. [Distribution]
- ADX (14): 21.0 with -DI 37.1 far above +DI 19.8. The trend is not yet strong, but the directional spread clearly favors sellers, and the -DI spike on the latest bar shows renewed selling. [Weak Trend, Bearish Direction]
- Volume: 10.48M on the latest bar, average to slightly above average for recent weeks, and well below the big spikes of the prior rallies. The decline from $577 to $424 came on decent volume with red bars dominating. The last bar is green but small, so there is no capitulation or strong reversal signature yet. [Neutral-to-Bearish, no capitulation]
DIVERGENCES & TRENDS
- No bullish divergence: Price made a new closing low at $424.30 (Oct 30) and RSI (35.7) and MACD (-19.4) also made lower lows, so momentum confirms the decline.
- Lower highs in RSI: The bounce high on Oct 27 reached only 48.9, and the Oct 21 bounce reached 42.4. Each rally is weaker than the last.
- Crossovers:
- MACD crossed below signal (bearish) in late October.
- −DI crossed above +DI on Oct 14 and has widened since.
- Price fell below EMA50 and SMA50D around Oct 14.
- EMA50 ($496) is now rolling over, while SMA50D is flat to slightly lower around $514.
- Long-term structure is still intact: Price is above EMA200 ($371.22) and SMA200D ($331.27), and the golden cross is long established. The 200-day averages are the next major supports. Price remains far above VWAP ($296.21), so the long-term picture is a pullback within an uptrend rather than a confirmed trend reversal.
- CMF has been mostly negative since the August-September highs, which is a warning that the push to $580 was not supported by strong buying.
CHART PATTERNS
- Bearish Double Top (reversal): The September peak (~$580-590) and the October peak (~$577) form a double top. The sharp drop of Oct 14-16 broke the intermediate neckline area near $500-510. The measured move from the neckline (~$80 below it) projects toward $420-430, roughly where price is now. A further extension would require a break of the $400 area.
- Failed breakout / return to the prior range: Price consolidated from June to August in roughly a $360-$480 band, broke out to ~$580, and has now fallen back inside. This is a classic bull trap. The base of the old range around $360-$385 (together with the EMA200 at $371) is the logical magnet.
- Bearish Flag/Pennant (continuation, tentative): The Oct 21-29 bounce between about $452 and $502 looks like a weak corrective rally that failed at the EMA50/SMA50D cluster. A break below $424 would confirm continuation, with the next target at the EMA200 area near $371.
POTENTIAL SCENARIOS
- Scenario 1: Bearish Retest of the 200-Day Zone — The failed breakout and double top play out, and sellers (−DI dominance, negative CMF, MACD below signal) push price through the lower Bollinger Band toward the EMA200 and the top of the old base. Trigger: daily close below $400 (lower band) on rising volume. Target: $371-$385, with an extension to $345-$360. Invalidation: a daily close above $486 (the Oct 21 swing high and the EMA50 area). (50% probability)
- Scenario 2: Neutral Choppy Base Between $385 and $480 — Price finds support near the lower band and EMA200, and ADX stays below 25. It oscillates in the old range with lower highs under the EMA50. Trigger: RSI holds above 30 and price stabilizes at $400-$430. Target: $400-$470 range-bound. Invalidation: a close below $371 or above $500. (25% probability)
- Scenario 3: Bullish Reclaim and Recovery — The pullback proves to be a healthy correction within the long-term uptrend. Price bounces from an oversold RSI, MACD momentum turns, and price reclaims the 50-day averages. Trigger: close above $496 with CMF above +0.05. Target: $540-$575 (retest of the double-top highs). Invalidation: a close back below $424. (25% probability)
PRICE TARGETS
- Target Price: $385.00 (97-day horizon, Feb 6, 2027)
- Expected Range: $335.00 to $440.00 (width $105, about 24.7% of the current price, consistent with the 61-180 day guidance of 18-30%)
- Key Levels: Support at $371.22 (EMA200 and top of the old base), Resistance at $486.00 (Oct 21 swing high, just under the EMA50 at $496.37)
OVERALL BIAS
OVERALL BIAS: BEARISH - Price has broken below the 50-day averages after a double-top and failed-breakout structure. MACD is below its signal, −DI dominates, CMF shows distribution, and RSI keeps making lower highs. The long-term uptrend (price above the 200-day averages) limits the downside, so the likeliest destination is the $370-$385 zone rather than a collapse.
This is educational analysis and not financial advice.