AAPL 97-day bullish forecast — Nov 1, 2026
- Bias: Bullish
- Timeframe: 97 days (made Nov 1, 2026, target date Feb 5, 2027)
- Price at analysis: $344.63
- Price target: $358.00
- Expected range: $312.00 – $392.00
- Result: Pending — graded after the close on Feb 5, 2027
Get a free AI analysis of AAPL today
Analysis
TECHNICAL INDICATORS
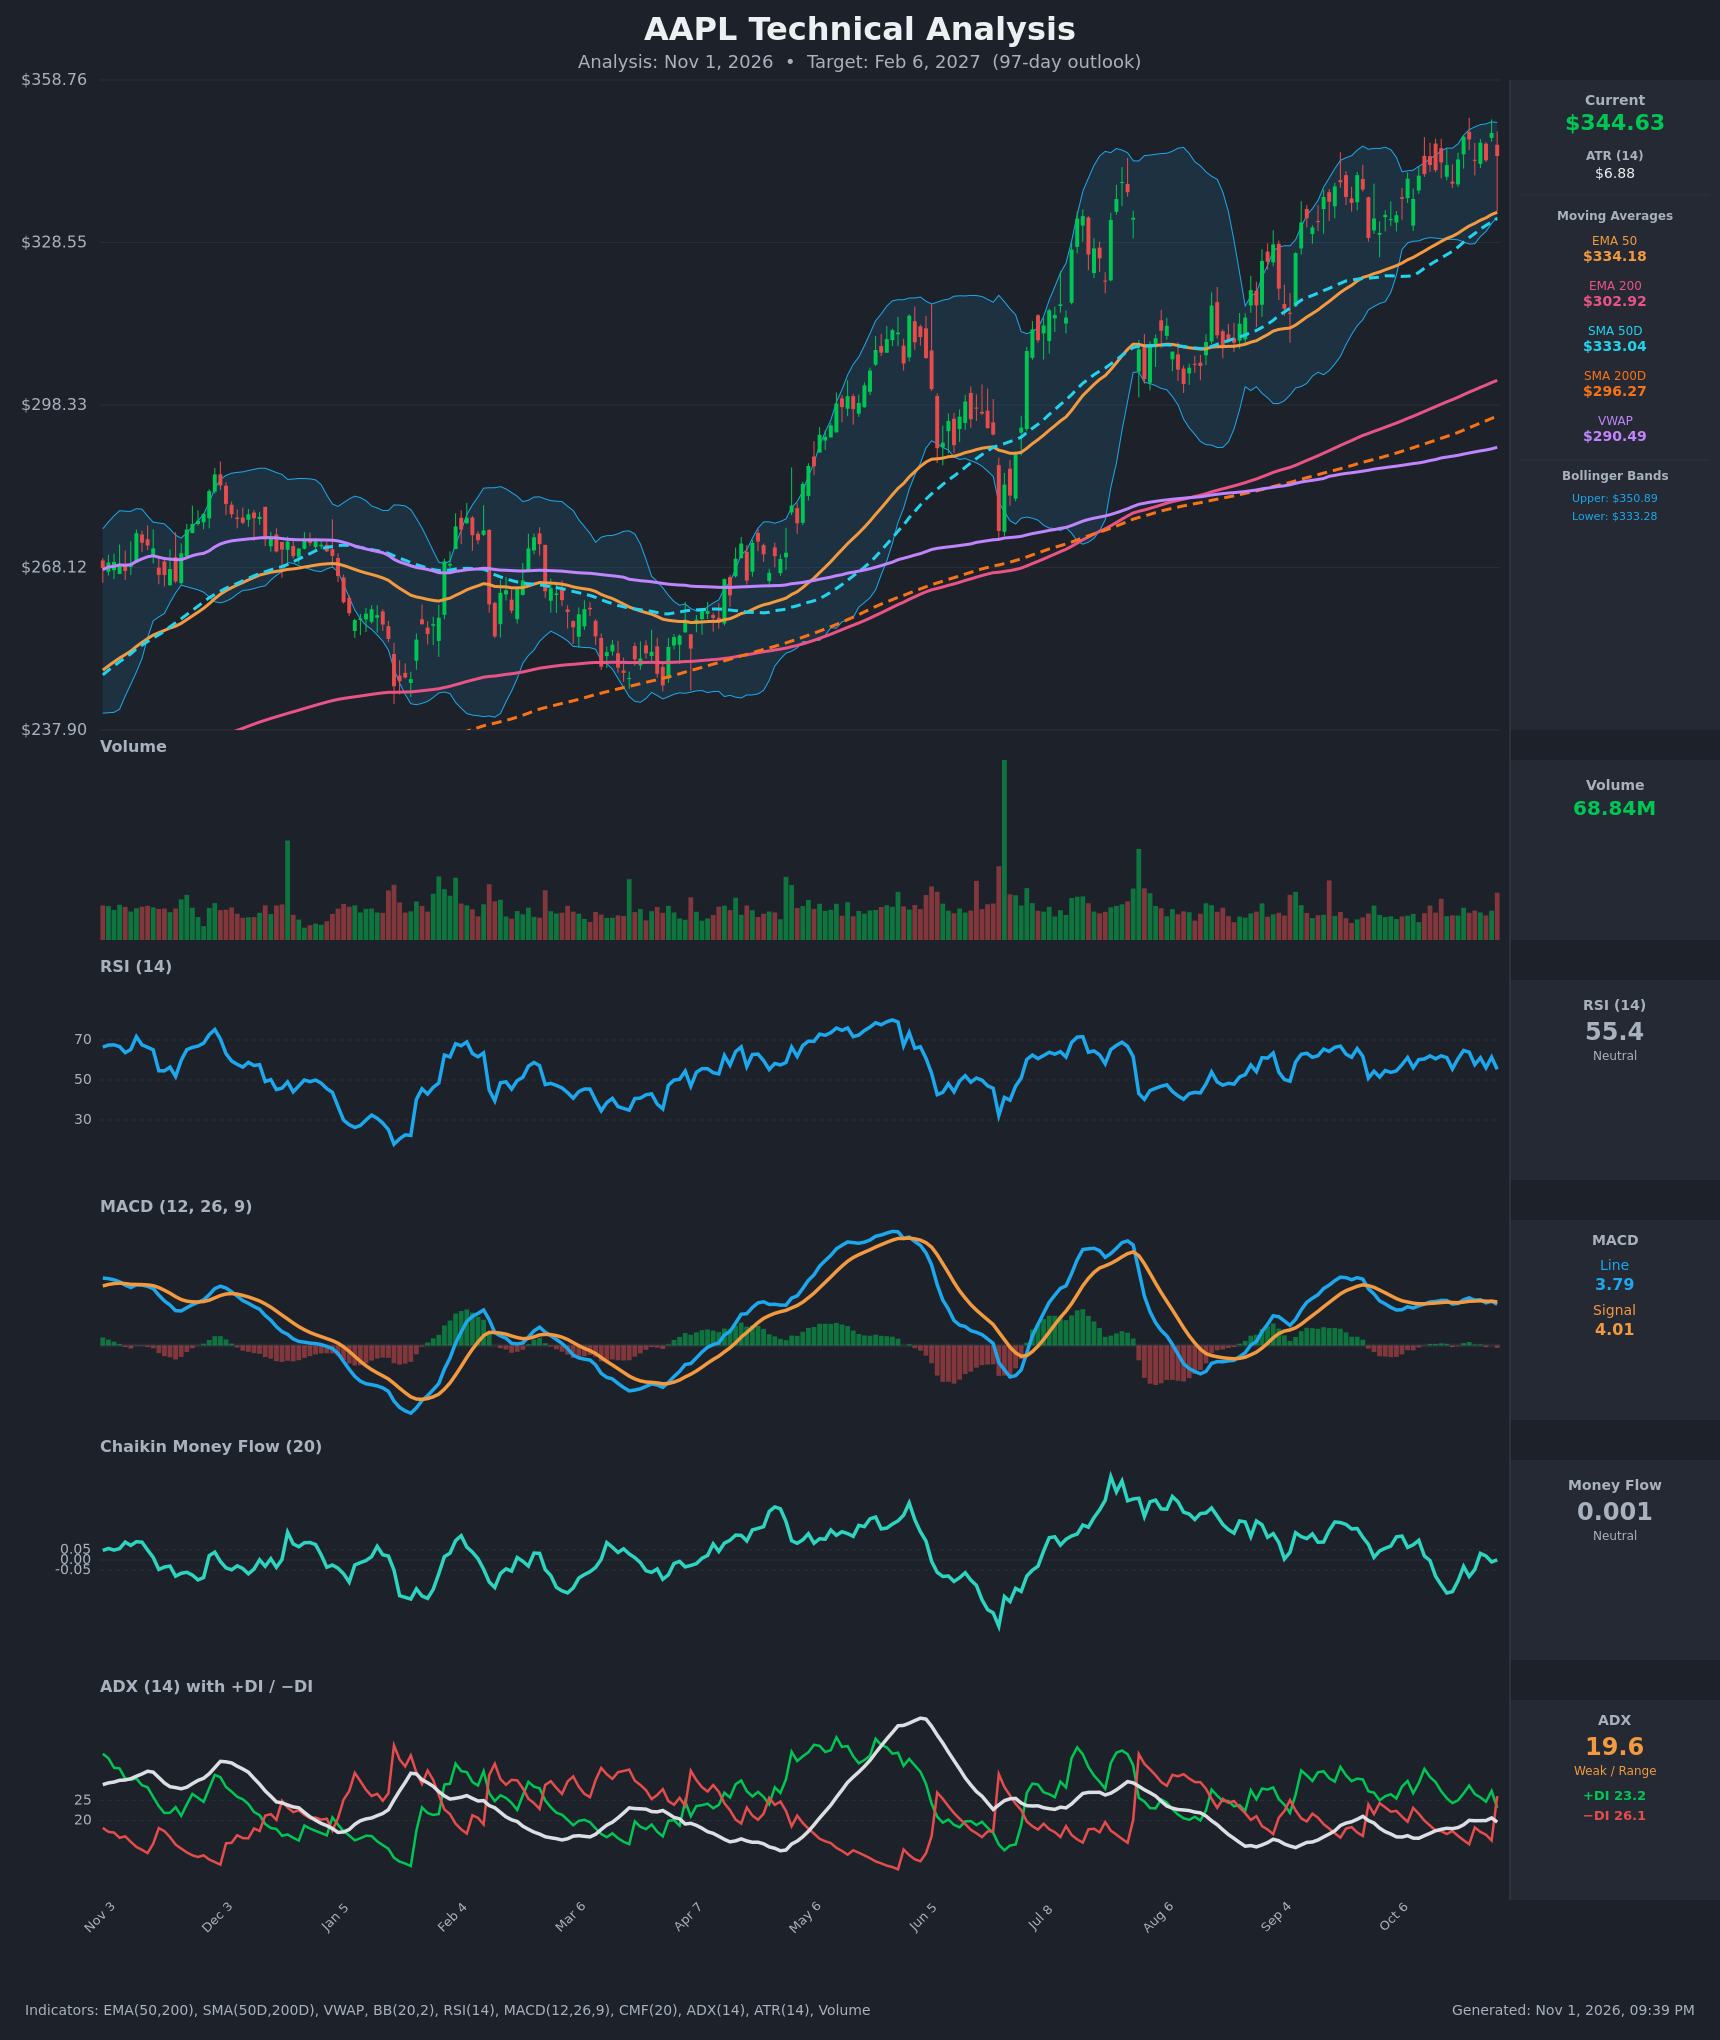
- RSI (14): 55.35, near the neutral midline. It has pulled back from 64.8 (Oct 22) and has oscillated between 55 and 65 for weeks without nearing overbought. Momentum is stable but not accelerating. [Neutral]
- 20 EMA: Not supplied, so the 20-period Bollinger midline (about $342) is the proxy. Price at $344.63 sits just above it. The EMA 50 ($334.18) and SMA 50D ($333.04) are about 3% below and rising, and price has held above them throughout the October advance. [Bullish]
- MACD: Line 3.79 is below Signal 4.01, a fresh bearish crossover on Oct 30 after the line peaked near 4.37. Both lines are flat and positive and the histogram is slightly negative. This shows momentum stalling, not a reversal. [Bearish]
- Bollinger Bands (20): Upper $350.89, lower $333.28, so price is in the upper half of the bands (about 65% of the range). The bands have been grinding higher with price riding the upper half, which is characteristic of an orderly uptrend. The recent high near $349 was rejected below the upper band. [Neutral]
- CMF (20): 0.001, inside the ±0.05 neutral zone. It has drifted from strongly positive in July–August to flat, so buying pressure has faded and the recent rally has had little volume confirmation. [Neutral]
- ADX (14): 19.6, below 20, so the trend is weak and range-like. −DI (26.1) just crossed above +DI (23.2), which is a minor bearish shift in directional control after weeks of +DI dominance. [Weak Trend, slight bearish tilt]
- Volume: 68.84M, above the recent average, and the latest candle is red with an upper wick. Volume has been generally subdued during the October grind higher, and the elevated volume on a down candle is a small caution. [Mildly Bearish / Distribution Warning]
Long-term structure is clearly bullish:
- Price is above the SMA 200D ($296.27), EMA 200 ($302.92), EMA 50 and SMA 50D.
- EMA 50 is above EMA 200 and the golden cross is established (SMA 50D $333.04 vs SMA 200D $296.27).
- VWAP ($290.49) is far below price.
DIVERGENCES & TRENDS
- Mild bearish momentum divergence: Price made a marginally higher high at $348.91 (Oct 29) versus $348.22 (Oct 22), while RSI peaked lower (61.4 vs 64.8) and MACD stayed below its Oct 23 peak (4.37).
- CMF trend: It has declined from strongly positive in the summer to flat or slightly negative in October while price kept rising. This is a volume-participation divergence.
- MACD: The bearish line/signal crossover on Oct 30 is flat and close to the zero-line, so the signal is weak.
- ADX/DI: ADX is rising slightly but is still under 20. The −DI over +DI crossover on the final bar is a first warning, not a confirmed trend change.
- Trend: Price has made higher highs and higher lows since the April–June breakout, and the 50/200 averages are all sloping upward.
- Moving averages: No death cross or bearish moving-average crossover is present, and price remains well above all major averages.
CHART PATTERNS
- Ascending channel / bullish continuation: Price has advanced in a stepped uptrend since April, with consolidations (the Jul–Aug base) followed by breakouts. This resembles the Bullish Flag and Ascending Triangle continuation concepts. The most recent three weeks form a tight $339–$349 range just above the rising 50-day averages, a small flag-like pause. A breakout above about $349–$351 would project a measured move toward $360–$370.
- Possible minor Bearish Double Top: Highs at $348.22 and $348.91 with a neckline near $339.50–$343. A close below $339.50 would activate this pattern, with a measured target of about $330, near the EMA 50 and SMA 50D. Its significance is limited because it is small and sits above rising support.
- Broader base: The Feb–Apr trough followed by the higher-low structure resembles a rounded or inverted head-and-shoulders base. The breakout from it has already been completed.
POTENTIAL SCENARIOS
- Scenario 1: Bullish Trend Continuation — The long-term uptrend resumes after the October consolidation, with price holding the 50-day averages and breaking above the upper Bollinger Band. Trigger: daily close above $351 on rising volume with MACD re-crossing above its signal. Target: $358–$372. Invalidation: close below $333 (EMA 50/SMA 50D/lower band). (48% probability)
- Scenario 2: Neutral Range Consolidation — Weak ADX (<20) and flat CMF keep price oscillating between the 50-day averages and the recent highs. Trigger: failure to close above $351 and failure to close below $333. Target: $334–$352 range with a drift near $345. Invalidation: a decisive close outside $330–$355. (27% probability)
- Scenario 3: Bearish Pullback / Double Top Confirmation — The −DI lead, MACD cross and fading CMF drive a correction toward the rising 200-day averages. Trigger: close below $339.50, then below $333. Target: $320, then $303–$312 (EMA 200 zone). Invalidation: reclaim of $351. (25% probability)
PRICE TARGETS
For the 97-day horizon (around Feb 6, 2027):
- Target Price: $358.00
- Expected Range: $312.00 to $392.00 (width $80, about 23% of the current price, consistent with the 18–30% guidance for 61–180 days)
- Key Levels: Support at $333.28, Resistance at $350.89
OVERALL BIAS
OVERALL BIAS: BULLISH - The primary uptrend is intact (golden cross, price above all major averages, higher highs and higher lows), and over 97 days upward drift is the most likely outcome. Conviction is modest because of the fresh bearish MACD cross, the −DI over +DI crossover, the weak ADX and neutral CMF, so a pullback toward $333 is likely along the way.
This is educational analysis and not financial advice.