AAL 97-day bullish forecast — Nov 1, 2026
- Bias: Bullish
- Timeframe: 97 days (made Nov 1, 2026, target date Feb 5, 2027)
- Price at analysis: $12.60
- Price target: $13.25
- Expected range: $11.20 – $14.60
- Result: Pending — graded after the close on Feb 5, 2027
Get a free AI analysis of AAL today
Analysis
TECHNICAL INDICATORS
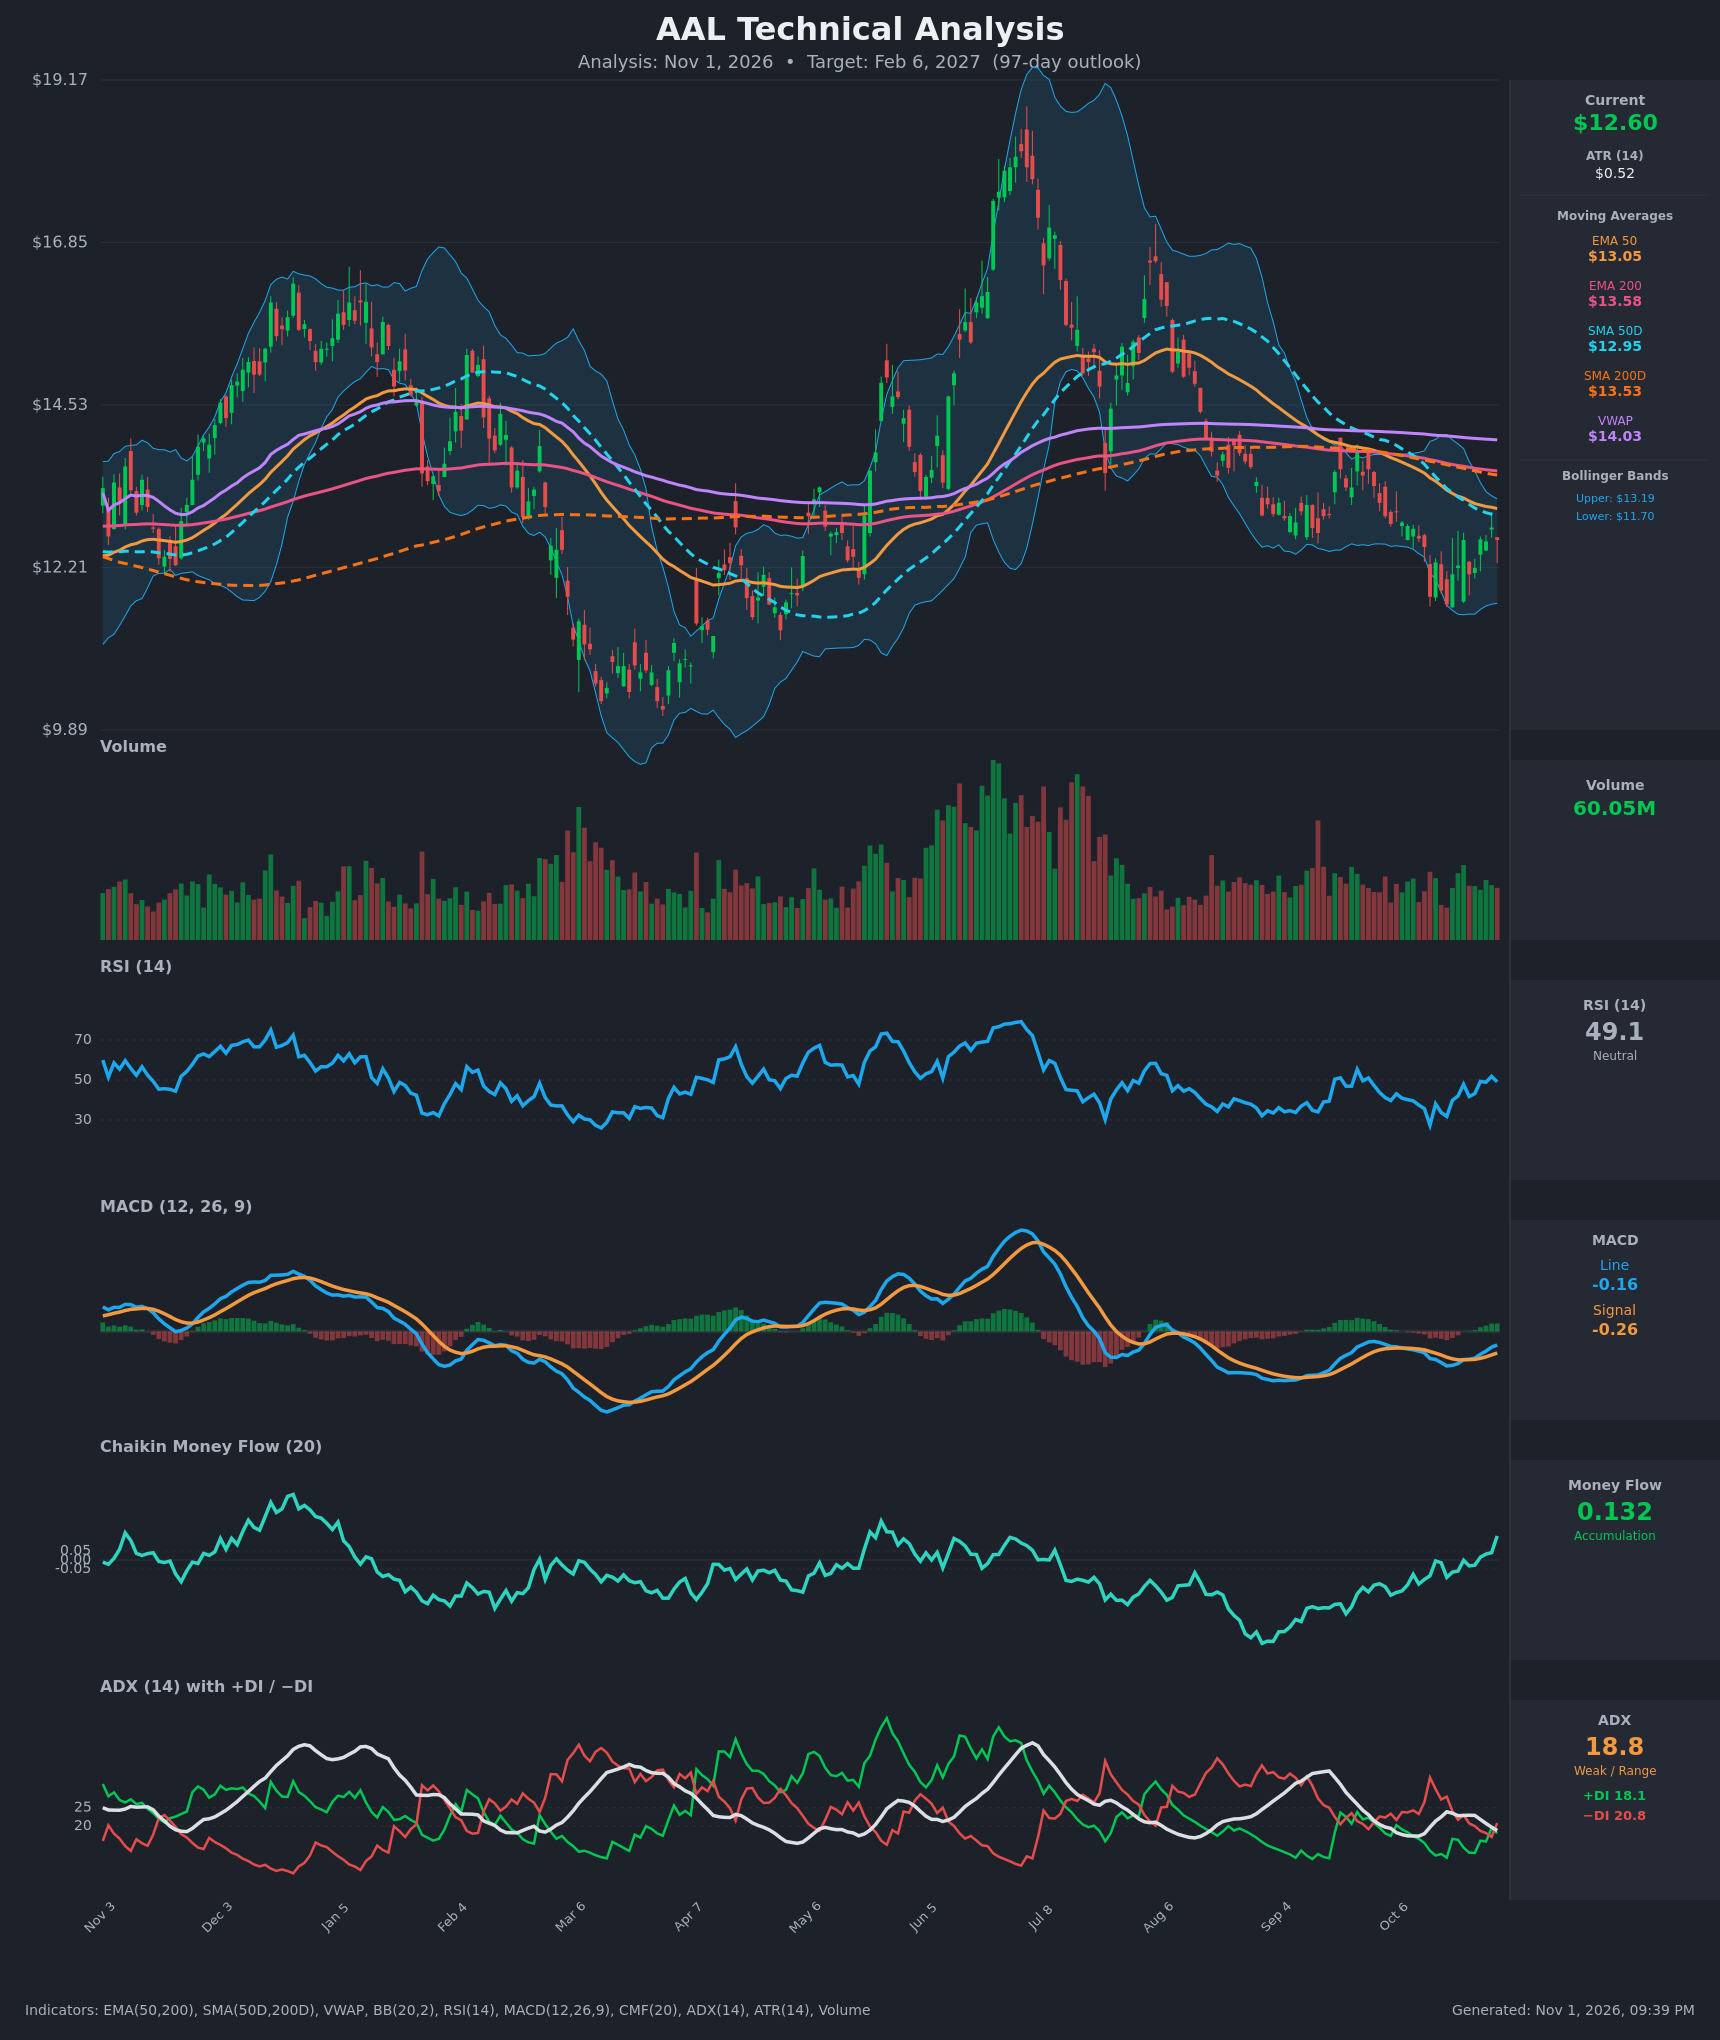
- RSI (14): 49.09, neutral. It has recovered from a deeply oversold 27.4 on Oct 14 and is now at the midline, so downside momentum has faded without reaching overbought. [Neutral]
- 20 EMA: Not supplied; the chart shows EMA 50 and EMA 200 instead. Price ($12.60) is below the EMA 50 ($13.05) and EMA 200 ($13.58), which are overhead resistance. The EMA 50 is still falling, but its slope has flattened from earlier in the month. [Bearish]
- MACD: Line -0.164 is above signal -0.260, so a bullish crossover happened around Oct 22. The histogram is positive and expanding, but both lines are still below zero, so this is a recovery inside a downtrend rather than a confirmed reversal. [Bullish]
- Bollinger Bands (20): Upper $13.19, lower $11.70, midline about $12.44. Price is above the midline after bouncing off the lower band at about $11.7. The bands are fairly narrow, which fits range behavior and leaves room to travel toward the upper band near $13.19. [Neutral]
- CMF (20): 0.132, well above +0.05. It has risen from -0.13 to positive over the last two weeks, a sustained shift toward accumulation. [Accumulation]
- ADX (14): 18.8, falling from 23.9, which means weak, range-bound conditions. −DI (20.8) is only marginally above +DI (18.1), and the two have been converging and crossing, so neither side controls the trend. [Weak Trend – slight bearish lean fading]
- Volume: 60.05M, in line with recent averages and well below the heavy volume of the June spike. Up-days have recently been equal to or heavier than down-days, which fits the positive CMF. There is no capitulation volume at the lows. [Neutral to mildly supportive]
Other context from the supplied data:
- SMA50D ($12.95) is below SMA200D ($13.53) and EMA50 is below EMA200, so both death crosses are already in place.
- Price is below SMA200D, which means a long-term downtrend.
- Price is below VWAP ($14.03), which means longer-term sellers are underwater.
DIVERGENCES & TRENDS
- Bullish divergence (mild): Price made a low at $11.68 on Oct 19, after $11.79 on Oct 14. RSI printed 27.4 on the first low and 31.8 on the second, and MACD and CMF have since turned up, so momentum and money flow are improving faster than price.
- Indicator trends: RSI rose from 27 to 49, MACD is making higher highs inside a still-negative zone, and CMF has gone from -0.13 to +0.13. ADX is fading, so the selloff has lost its trend strength.
- Crossovers: MACD crossed bullishly above its signal line. The +DI/−DI lines are converging and flipping (+DI briefly led on Oct 29). The long-term MAs (EMA50/200, SMA50/200) are stacked bearishly and still declining slowly.
- Structure: The chart shows a series of lower highs since the June peak near $19, from about $17 to about $14 and then about $13.5. Price has to reclaim the $13.0–13.6 MA cluster to break that sequence.
CHART PATTERNS
- Bullish Double Bottom (developing): The lows at about $11.79 (Oct 14) and $11.68 (Oct 19) form a W with a neckline around $12.60–12.80. A breakout above the neckline would give a measured move of roughly $0.9–1.0, toward $13.5.
- Bullish Falling Wedge / downtrend channel (macro): The decline from the August high has been orderly with narrowing volatility. A move above the $13.0 EMA50 would support this reversal read.
- Overhead resistance: The EMA200, SMA200 and VWAP sit at $13.5–14.0 and are the main barrier to a larger recovery. The pattern is unconfirmed until price clears the neckline and the EMA50.
POTENTIAL SCENARIOS
- Scenario 1: Bullish Double-Bottom Recovery to the MA Cluster — Accumulation (CMF) and the MACD cross carry price above the neckline and the EMA50/SMA50, and it grinds up into the $13.2–13.6 moving-average cluster. Trigger: daily close above $13.05 with MACD pushing toward zero. Target: $13.25 initially, with an extension to $13.60–14.00. Invalidation: close below $11.70. (45% probability)
- Scenario 2: Bearish Downtrend Resumption — Price is rejected at the falling EMA50/SMA50 and the overhead death-cross structure keeps pressing, so the lower-high sequence continues. Trigger: failure at $13.0 followed by a close below $12.0. Target: $11.70, then $10.80–11.00. Invalidation: close above $13.60. (35% probability)
- Scenario 3: Neutral Range Chop — With ADX below 20, price oscillates between $11.70 and $13.19, the Bollinger band extremes. Trigger: repeated failures at both extremes. Target: $12.30–12.90. Invalidation: close outside the $11.70–$13.60 range. (20% probability)
PRICE TARGETS
- Target Price: $13.25 (97-day horizon, to Feb 6, 2027)
- Expected Range: $11.20 to $14.60 (width $3.40, about 27% of the current price, in line with the 18–30% guidance for 61–180 days)
- Key Levels: Support at $11.70, Resistance at $13.55
OVERALL BIAS
OVERALL BIAS: BULLISH - Momentum and flow have turned up: a MACD bullish crossover, RSI recovering from oversold, CMF in accumulation, and a developing double bottom near $11.7. Overhead MAs and the death crosses cap the upside, so the target is a measured move to about $13.25 rather than a full trend reversal, and conviction is modest.
This is educational analysis and not financial advice.