F 97-day bullish forecast — Nov 1, 2026
- Bias: Bullish
- Timeframe: 97 days (made Nov 1, 2026, target date Feb 5, 2027)
- Price at analysis: $12.25
- Price target: $12.85
- Expected range: $11.15 – $13.90
- Result: Pending — graded after the close on Feb 5, 2027
Get a free AI analysis of F today
Analysis
TECHNICAL INDICATORS
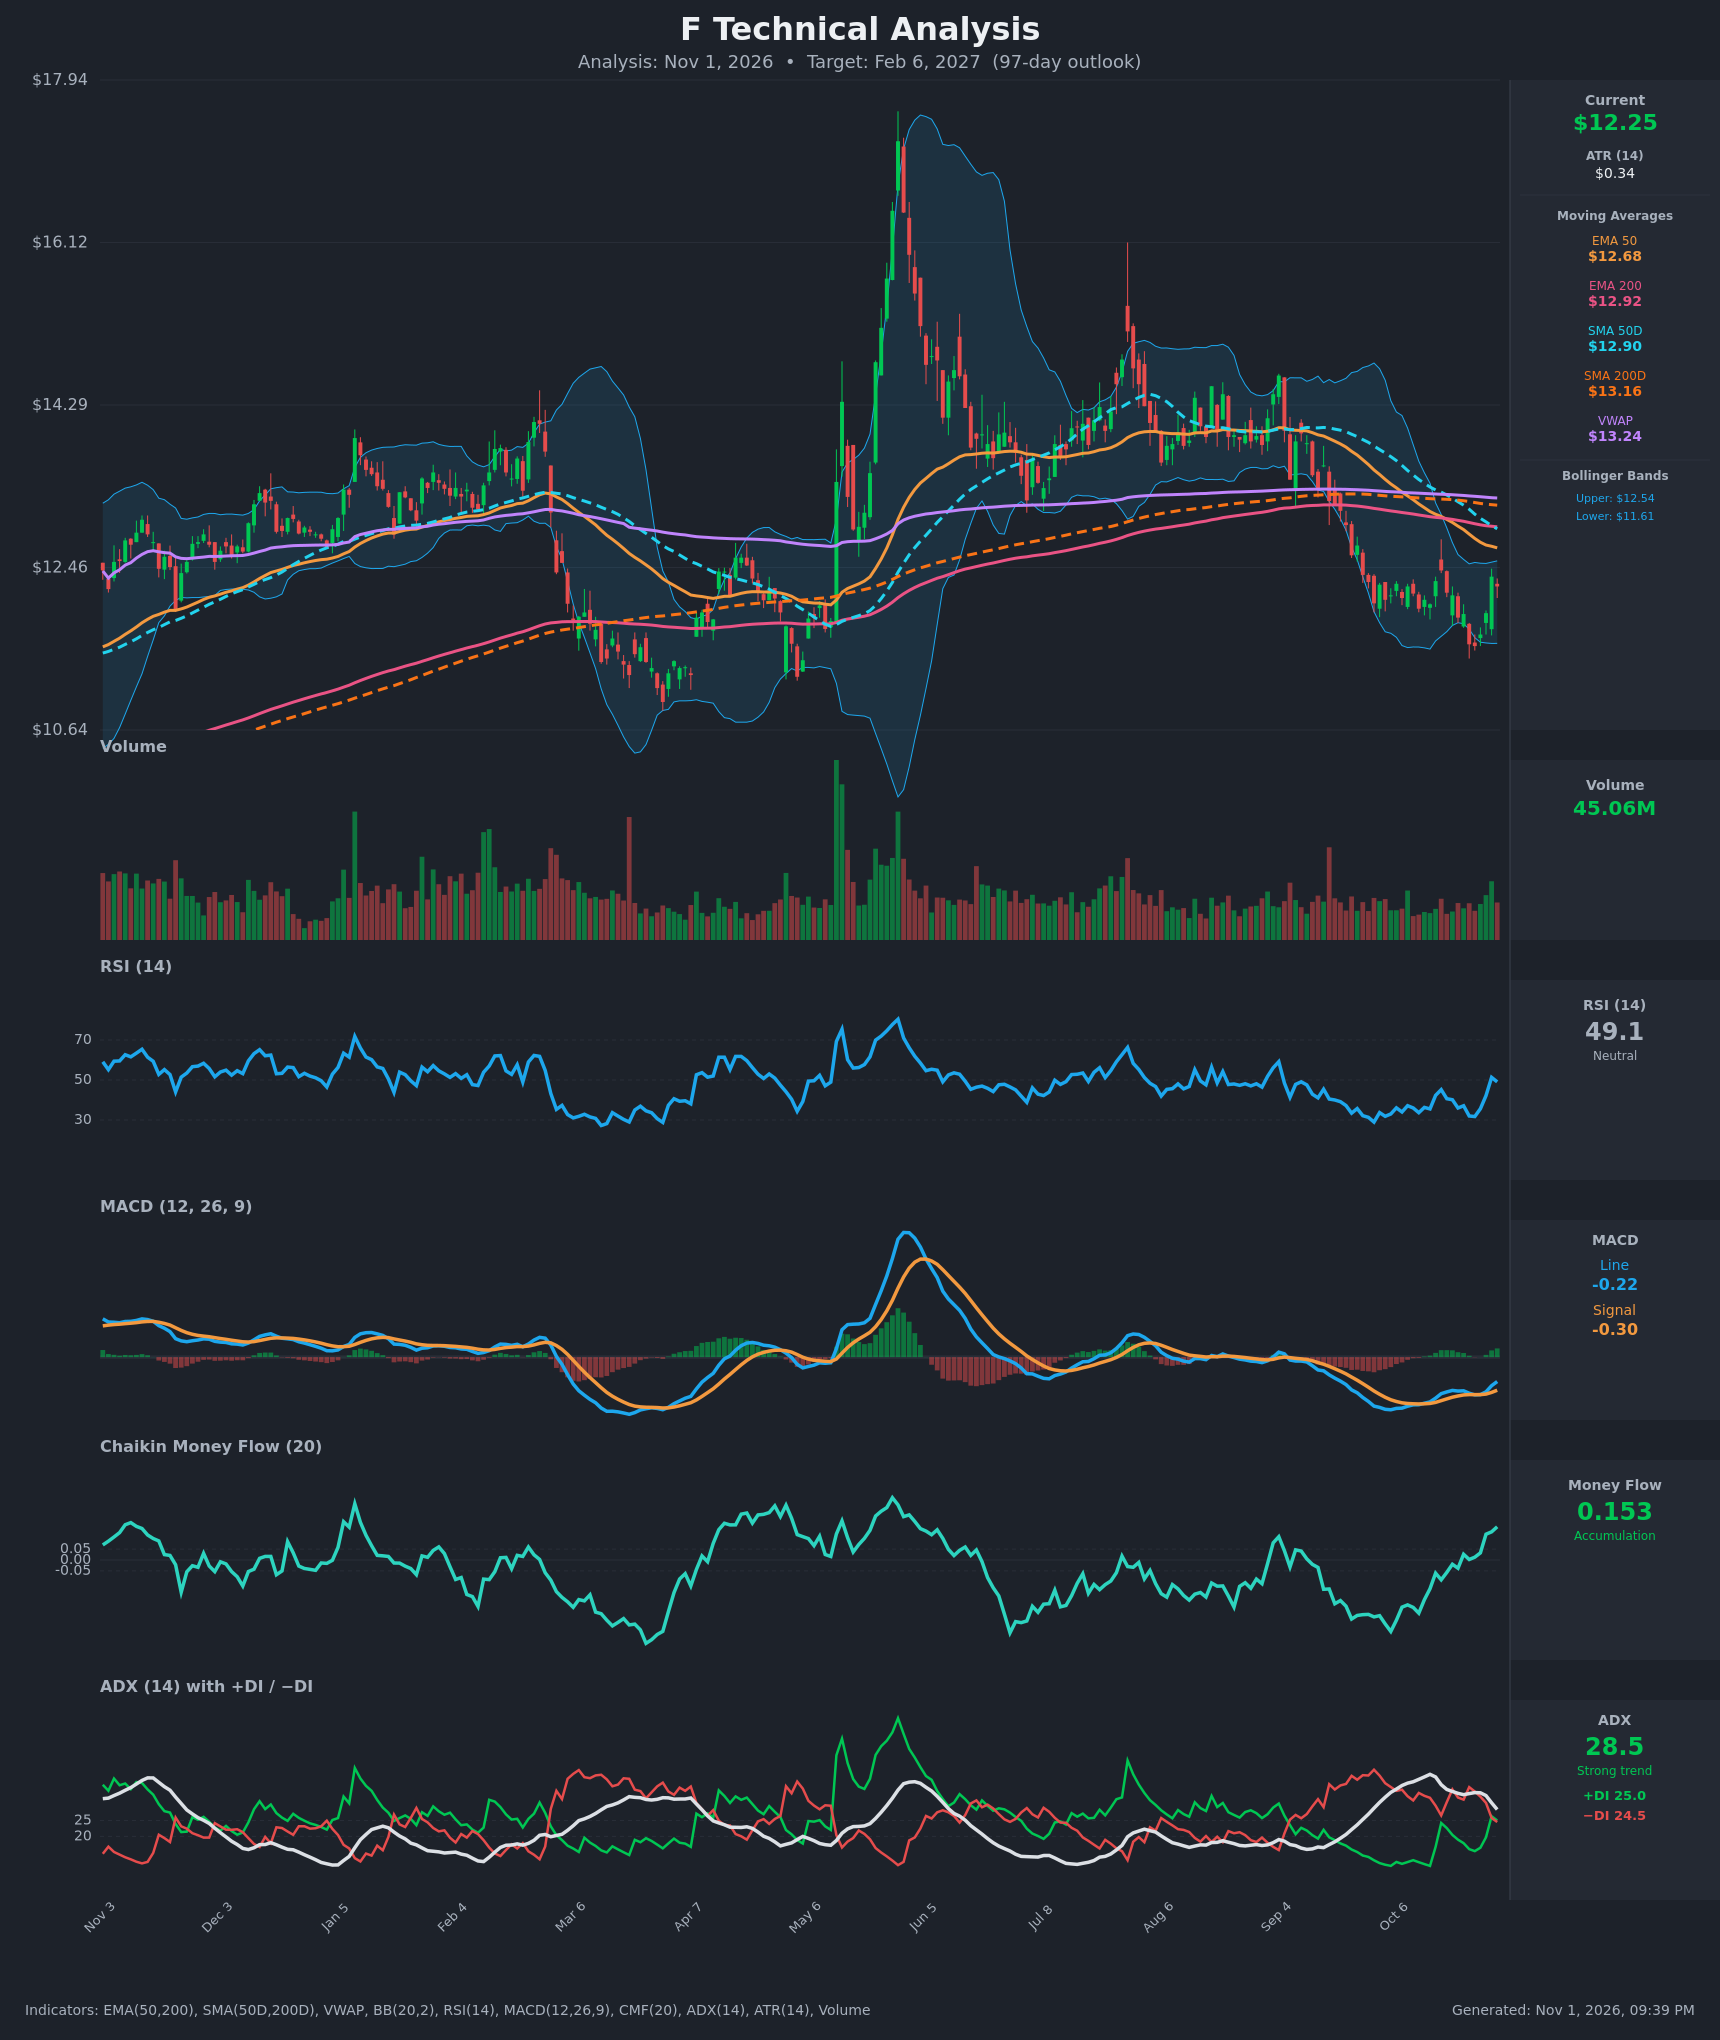
- RSI (14): 49.07, right at the neutral midline. It has rebounded sharply from 31.7 on Oct 26, so momentum is rising, but the Oct 29 reading of 51.3 has already pulled back slightly. [Neutral]
- 20 EMA: The 20 EMA wasn't supplied. Using the supplied EMA 50 ($12.68) as the trend proxy, price at $12.25 is below it, so it acts as overhead resistance. EMA 50 is still falling and sits below EMA 200 ($12.92), a bearish alignment. The Bollinger midline (~$12.07) is the short-term mean, and price is just above it. [Bearish]
- MACD: Line -0.223 is above signal -0.302, giving a positive histogram of about +0.08. The line crossed above the signal on Oct 28 and the gap is widening. Both lines are still below zero, so this is a recovery from a bearish phase rather than a confirmed uptrend. [Bullish]
- Bollinger Bands (20): Upper $12.54, lower $11.61, midline ~$12.07. Price sits in the upper half of the bands after bouncing off the lower band on Oct 23-26. The bands are fairly narrow (~7.5% wide), so volatility is compressing. [Neutral]
- CMF (20): 0.153, well above +0.05 and rising steadily from negative readings (-0.245 on Oct 12). This is clear accumulation, and it is diverging positively from the weak price. [Accumulation]
- ADX (14): 28.5 and falling from 39.5, so the prior downtrend is losing strength. +DI (25.0) just crossed above −DI (24.5) after trailing by 20+ points, but the margin is razor thin. [Strong but fading trend, early bullish DI shift]
- Volume: 45.06M, with the latest bar green and above recent average volume. This suggests real buying on the bounce, but there is no capitulation spike or decisive breakout volume yet. [Mildly bullish]
DIVERGENCES & TRENDS
- Positive CMF divergence: price made a low at $11.58 on Oct 26, while CMF has since climbed from about -0.25 to +0.15 and is now at its highest in months. This is evidence of accumulation near the lows.
- RSI / MACD: RSI recovered from 31.7 to 49. The MACD bullish crossover (Oct 28) came from deeply negative territory. There was no strong bullish divergence at the low, but momentum has clearly turned up.
- Moving-average structure is bearish:
- EMA 50 crossed below EMA 200 around Oct 19.
- SMA 50D crossed below SMA 200D around Oct 21, a death cross.
- Price is below all of them: EMA 50 ($12.68), EMA 200 ($12.92), SMA 50D ($12.90), SMA 200D ($13.16) and VWAP ($13.24).
- DI crossover: +DI moved above −DI on Oct 30, the first bullish DI crossover since the September selloff. ADX is falling, which means the downtrend is exhausting rather than accelerating.
- Chart context: the Sep-Oct decline broke the $13.80-14.00 consolidation and fell to the $11.60 area, in line with the lower end of the year's range ($10.90 in Mar-Apr, $17.9 spike in May-Jun).
CHART PATTERNS
- Bullish Falling Wedge / descending channel: the Sep-Oct decline looks like a falling channel with converging lows. The Oct 29 bounce above the channel and the Bollinger midline is an early breakout attempt. The pattern projects a retracement toward the start of the channel (~$13.20-13.80), though only partial follow-through is likely given heavy overhead MAs.
- Possible Bullish Double Bottom: the $11.58-11.60 lows (Oct 23-26) are a potential first leg. The neckline is around $12.40-12.45 (Oct 16 high $12.43). A close above it would be confirmation, with a measured target of ~$13.2.
- Failure scenario (Bearish Flag): if price stalls below the $12.68-12.92 MA cluster and rolls over, it would be a bearish flag within the downtrend, with a target below $11.58 toward $10.90-11.00.
POTENTIAL SCENARIOS
- Scenario 1: Bullish Recovery to the MA Cluster — Accumulation (CMF +0.15), the MACD cross and the DI flip support a rebound into the $12.70-13.20 zone, where EMA 50, EMA 200 and SMA 50D converge. Trigger: daily close above $12.45 (double-bottom neckline), then above $12.68 (EMA 50). Target: $12.85-13.20. Invalidation: close below $11.58. (45% probability)
- Scenario 2: Bearish Rejection and Retest of Lows — Price fails at the falling EMA 50/EMA 200 and the death cross drives continuation lower. Trigger: rejection at $12.68-12.92 and a close below $11.95. Target: $11.60, then $10.90-11.20. Invalidation: close above $13.20. (35% probability)
- Scenario 3: Neutral Range Chop — Price oscillates between $11.60 and $12.90 as ADX decays toward 20 and the DI lines intertwine. Trigger: repeated failures at both ends of the range. Target: ~$12.20. Invalidation: close outside $11.55-13.20. (20% probability)
PRICE TARGETS
- Target Price: $12.85 (97 days, Feb 6, 2027)
- Expected Range: $11.15 to $13.90 (width $2.75, about 22.4% of the current price, in line with the 18-30% guidance for 61-180 days)
- Key Levels: Support at $11.58, Resistance at $12.68 (EMA 50). Above that, the $12.90-13.16 cluster is the next barrier.
OVERALL BIAS
OVERALL BIAS: BULLISH - The bounce off $11.58 is backed by strong CMF accumulation (+0.153), a bullish MACD crossover, a +DI/−DI flip and fading ADX downtrend strength. That favors a mean-reversion move toward the $12.7-13.2 moving-average cluster over 97 days. Conviction is modest because price is still below all major MAs and the death cross is fresh.
This is educational analysis and not financial advice.