GOOGL 97-day bullish forecast — Nov 1, 2026
- Bias: Bullish
- Timeframe: 97 days (made Nov 1, 2026, target date Feb 5, 2027)
- Price at analysis: $279.84
- Price target: $298.00
- Expected range: $258.00 – $324.00
- Result: Pending — graded after the close on Feb 5, 2027
Get a free AI analysis of GOOGL today
Analysis
TECHNICAL INDICATORS
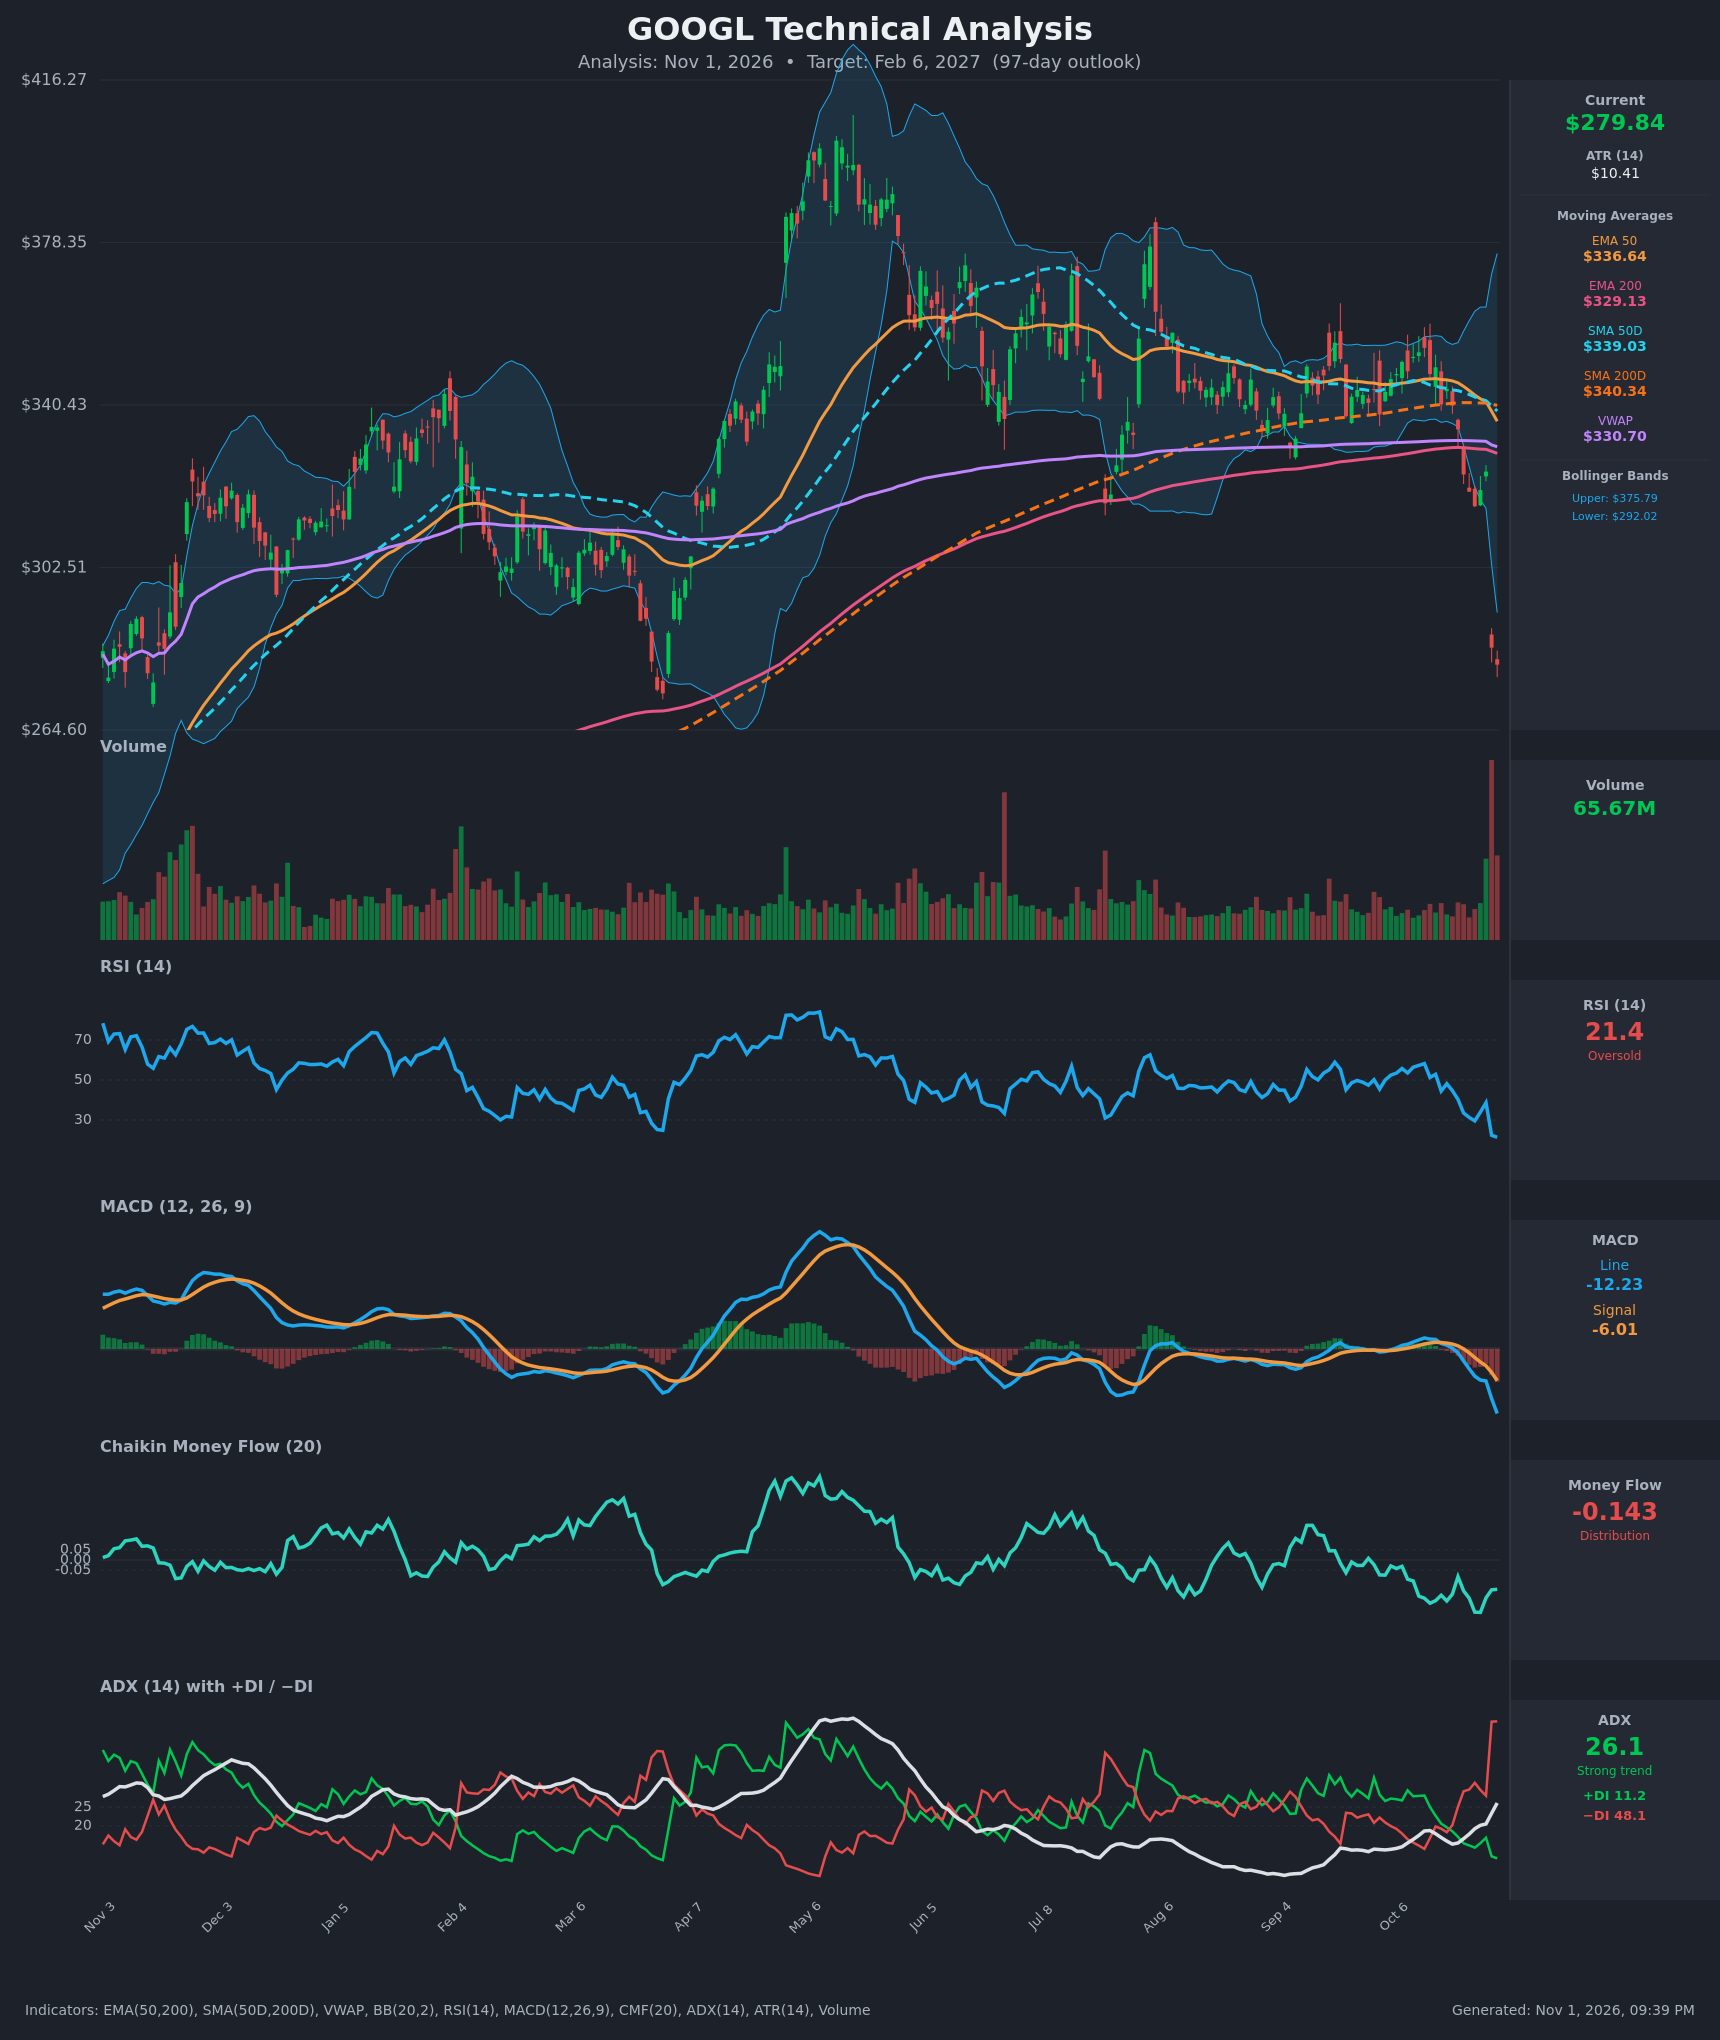
- RSI (14): 21.38, deeply oversold. It fell from 57 on Oct 12 to 22 on Oct 29 and 21 now. Momentum is still pointing down, but this is a washout reading that has historically come before relief bounces (March low on the chart). [Neutral, leaning Bullish on a contrarian basis]
- 20 EMA: The 20 EMA isn't supplied, so I use the EMA 50 at $336.64 and EMA 200 at $329.13. Price at $279.84 is about 17% below the EMA 50 and 15% below the EMA 200, so both now act as heavy overhead resistance. The EMA 50 has crossed below the EMA 200 in slope terms and is about to cross. [Bearish]
- MACD: The line at -12.23 is below the signal at -6.01, and the histogram is about -6.2 and widening. The bearish crossover happened around Oct 21-22 and the gap is still expanding. [Bearish]
- Bollinger Bands (20): The bands are $292.02 to $375.79. Price closed well below the lower band after a roughly 12.6% gap down on Oct 29, and the bands are widening sharply. A close outside the band is a stretched, high-volatility condition, and it often leads to a snap-back toward the mid-band. [Bearish near term, with a mean-reversion risk]
- CMF (20): -0.143, well below -0.05. It has been negative for months and is now at a low, which shows persistent distribution. [Distribution]
- ADX (14): 26.1 and rising from 15 two weeks ago. −DI at 48.1 is far above +DI at 11.2. This is a strong, newly established downtrend with bears firmly in control. [Strong Trend, Bearish]
- Volume: 65.67M, the highest bar on the chart by a wide margin. The gap day was a heavy-volume breakdown, which suggests institutional repricing. It could also mark a capitulation or climax. [Bearish confirmation, with possible capitulation]
DIVERGENCES & TRENDS
- No bullish RSI or MACD divergence yet. Price, RSI and MACD all made new lows together, so momentum confirms the move.
- RSI is at its lowest level on the whole chart, below the March low (~28-30). That is an extreme condition, not a divergence.
- SMA 50D ($339.03) has just crossed below SMA 200D ($340.34), a fresh death cross. EMA 50 ($336.64) is also about to cross EMA 200 ($329.13), and both are rolling over.
- Price is below VWAP ($330.70), SMA 50D and SMA 200D, so it is well below every major average.
- +DI is at its lowest in the visible history while −DI spiked to a one-year high, so trend pressure is one-sided.
- CMF has made a series of lower lows since June.
- A gap now sits between about $284 and $325 (Oct 28 close $324.89 to Oct 29 close $283.82). It will act as supply on any bounce.
CHART PATTERNS
- The prior range from August to October, roughly $335-$355, resembled a Bearish Rising Wedge / topping range around the flat MAs. Its downside break has now played out as a violent gap-down.
- The price drop is a breakdown continuation toward the March swing low zone near $264-$272. This is not a clean textbook pattern from the reference diagram.
- The measured move from the $335 range floor down by the range height (~$20-$25) would put the target near $310, which has already been exceeded. That points to overextension, not an orderly continuation.
- A potential Bullish Double Bottom could form if price retests the $265-$272 area (the March low) and holds on a higher RSI low. That is not confirmed yet.
POTENTIAL SCENARIOS
- Scenario 1: Bullish Oversold Relief and Partial Gap Fill — RSI at 21 and a close far outside the lower Bollinger Band after a capitulation-volume gap often lead to a base and a multi-week rebound. Price probably consolidates in the $265-$290 zone, then drifts up toward the lower BB and the bottom of the gap. Trigger: reclaim of $292 (lower BB) on a close with MACD histogram contracting. Target: $298 on the 97-day horizon, with an extension to $320-$325 at the gap origin. Invalidation: a daily close below $264.60 (chart low). (45% probability)
- Scenario 2: Bearish Trend Continuation — ADX is rising, −DI dominates, the death cross is fresh and CMF shows distribution, so a lower-high bounce into the $300-$320 gap could fail, followed by a slide through support. Trigger: rejection at $292-$305 or a break below $264.60. Target: $245-$255 (about 10-12% below spot). Invalidation: a weekly close above $325 (gap fully filled). (40% probability)
- Scenario 3: Neutral Volatile Base — Price chops between $265 and $300 for most of the period without resolving. Trigger: an inside range after the gap with ADX fading below 20. Target: about $280. Invalidation: a close outside the $260-$305 range. (15% probability)
PRICE TARGETS
For the 97-day horizon (to about Feb 6, 2027), I weigh the extreme oversold, capitulation-style gap against a strongly bearish trend structure. I lean toward a partial mean-reversion rebound but keep a wide range, since the downside trend is still intact.
- Target Price: $298.00
- Expected Range: $258.00 to $324.00 (width $66 = about 23.6% of the current price, consistent with the 18-30% guide for 61-180 days)
- Key Levels: Support at $264.60, Resistance at $292.02
OVERALL BIAS
OVERALL BIAS: BULLISH - Price is extremely oversold (RSI 21.4) and trades far below the lower Bollinger Band after a capitulation-volume gap, with major support at $264-$272 nearby. That favors a partial rebound toward the $292-$324 gap zone over 97 days. The downtrend signals (ADX 26 with −DI 48, bearish MACD, negative CMF, fresh death cross) are strong, so conviction is modest and a failed bounce is a real risk.
This is educational analysis and not financial advice.