HOOD 97-day bullish forecast — Nov 1, 2026
- Bias: Bullish
- Timeframe: 97 days (made Nov 1, 2026, target date Feb 5, 2027)
- Price at analysis: $84.99
- Price target: $91.00
- Expected range: $76.00 – $100.00
- Result: Pending — graded after the close on Feb 5, 2027
Get a free AI analysis of HOOD today
Analysis
TECHNICAL INDICATORS
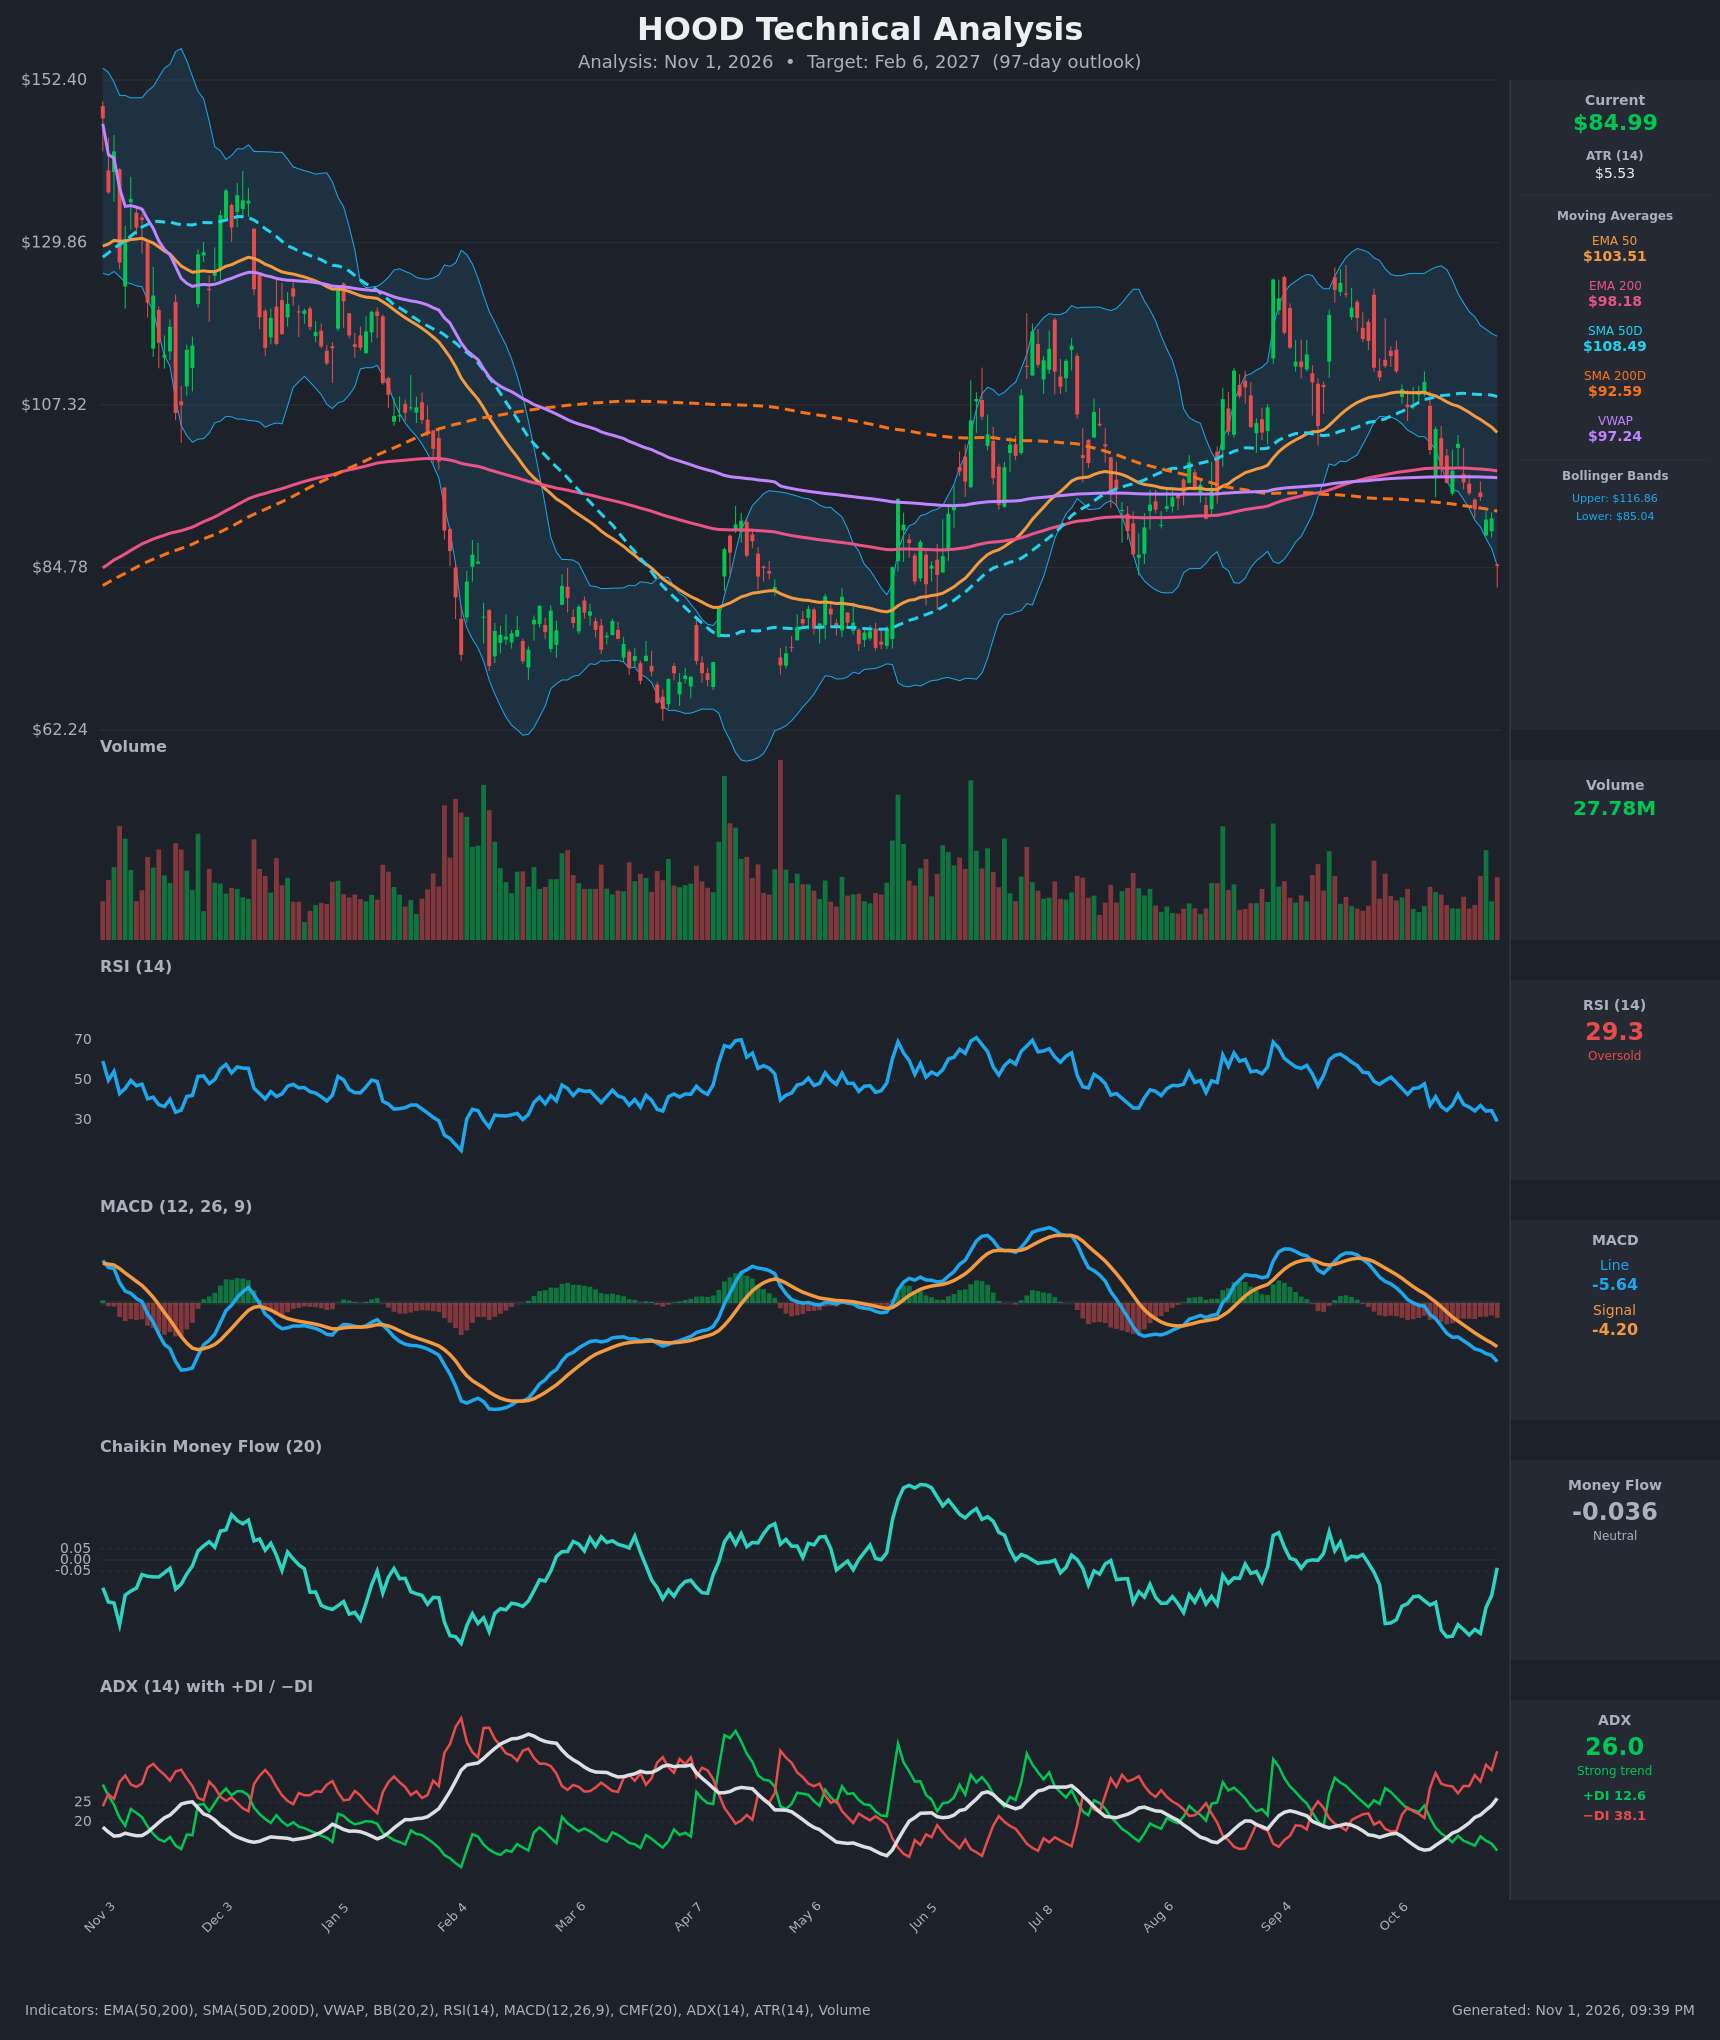
- RSI (14): 29.3, in oversold territory after falling from 46 on Oct 12. Momentum is clearly down, but this is the lowest reading since the early-year washout. Oversold readings at the lower Bollinger Band often precede relief bounces, though they can persist in strong downtrends. [Neutral]
- 20 EMA: Not supplied. The EMA 50 ($103.51) sits about 22% above price and is falling, and the VWAP ($97.24) is also well overhead. Price is below the EMA 50, EMA 200 ($98.18), SMA 50D ($108.49), SMA 200D ($92.59) and VWAP, so every average is now resistance. [Bearish]
- MACD: Line -5.64 is below the signal at -4.20, with the bearish crossover on Oct 16. The histogram is negative and still widening, so downside momentum is accelerating rather than fading. [Bearish]
- Bollinger Bands (20): Price at $84.99 is just under the lower band ($85.04), against an upper band of $116.86. This is a stretched, wide-band, 2-sigma extreme. It signals strong selling pressure, but also a high statistical chance of a bounce toward the mid-band (~$101). [Neutral]
- CMF (20): -0.036, inside the neutral zone. It has recovered sharply from -0.35 (Oct 19–23) as volume rose on the final bars, so selling pressure is easing and the first hint of buying appears at the lows. [Neutral]
- ADX (14): 26.0 and rising from 13 two weeks ago, with −DI at 38.1 well above +DI at 12.6. This is a strong, accelerating downtrend with bears firmly in control. [Strong Trend – Bearish]
- Volume: 27.78M on the latest bar, among the heaviest recent bars, on a ~7% drop to new lows. That reads as capitulation-type selling. Heavy volume at support can mark exhaustion, but the move is not yet confirmed as a bottom. [Bearish/Possible Capitulation]
DIVERGENCES & TRENDS
- No bullish RSI or MACD divergence has formed yet. Both are making new lows with price, so momentum confirms the decline.
- The MA structure is mixed. The SMA 50D ($108.49) is above the SMA 200D ($92.59) and the EMA 50 ($103.51) is above the EMA 200 ($98.18), so there is no death cross. The EMA 50 is falling toward the EMA 200, though, and a bearish cross is possible within weeks if weakness persists.
- Price has broken below both 200-day averages, which had acted as support since mid-year. This is a long-term trend deterioration.
- CMF is turning up sharply while price makes new lows. This is an early, unconfirmed positive divergence that suggests dip-buying.
- ADX is rising with −DI dominant, so the trend is strengthening. +DI is at a very low 12.6, which is typical of an exhausted, one-sided move.
- The price lows of ~$84–85 line up with the August swing low, so this is a retest of support.
CHART PATTERNS
- Possible Bullish Double Bottom: The current low near $85 retests the August low (~$84–85). If this holds, the pattern's neckline sits near the $98–103 zone (EMA 200, VWAP, EMA 50). A breakout above it would project toward ~$115–120. It is not confirmed until a bounce and neckline break occur.
- Bearish Breakdown / Failed Range: Price rejected twice at ~$120–128 (lower-high structure relative to the year's start) and has now broken below the 200-day averages. If $84 fails, the next reference is the $72–76 base from spring, and the measured move from the broad $85–128 range would point toward ~$65–70.
- No clean continuation pattern is present. The structure is a wide range with a downside test of its lower boundary.
POTENTIAL SCENARIOS
- Scenario 1: Bullish Oversold Relief Bounce / Double Bottom — Price holds the $84–85 August low, RSI resets from oversold, CMF turns positive, and the stock mean-reverts toward the SMA 200D and VWAP zone, then stalls under the EMA 200/VWAP. Trigger: daily close back above $92.59 (SMA 200D) with MACD histogram shrinking. Target: $92–100, with extension to $103 (EMA 50). Invalidation: close below $80. (45% probability)
- Scenario 2: Bearish Trend Continuation — Strong ADX with −DI dominance carries price through the August low and the Bollinger lower band. Rallies are sold at the 200-day averages, and a bearish EMA 50/200 cross follows. Trigger: close below $82 on heavy volume. Target: $72–76 (spring base), with a stretch to $68. Invalidation: reclaim of $98 (EMA 200/VWAP). (40% probability)
- Scenario 3: Neutral Choppy Base — Price oscillates between $78 and $96 for most of the window as the stock builds a base after capitulation. Trigger: ADX falling back below 20 with RSI holding 35–55. Target: $85–92. Invalidation: close outside $76–$100. (15% probability)
PRICE TARGETS
- Target Price: $91.00 (97-day horizon, about +7% from $84.99; partial mean reversion toward the SMA 200D, which sits near $92.59)
- Expected Range: $76.00 to $100.00 (width $24 ≈ 28% of the current price, in line with the 61–180 day guidance)
- Key Levels: Support at $80.00 (intermediate, with $76.00 as the major spring-base floor), Resistance at $92.59 (SMA 200D, followed by $98.18 EMA 200 / $97.24 VWAP)
OVERALL BIAS
OVERALL BIAS: BULLISH - The stock is deeply oversold (RSI 29, price at the lower Bollinger Band) on capitulation volume, retesting the August $84–85 low. CMF is recovering, and a 97-day horizon favors at least partial mean reversion toward ~$91–92. Conviction is modest because trend indicators (MACD, ADX/−DI, all MAs overhead) remain bearish, and a close below $80 would invalidate the call.
This is educational analysis and not financial advice.