MSFT 97-day bearish forecast — Nov 1, 2026
- Bias: Bearish
- Timeframe: 97 days (made Nov 1, 2026, target date Feb 5, 2027)
- Price at analysis: $521.91
- Price target: $500.00
- Expected range: $448.00 – $562.00
- Result: Pending — graded after the close on Feb 5, 2027
Get a free AI analysis of MSFT today
Analysis
TECHNICAL INDICATORS
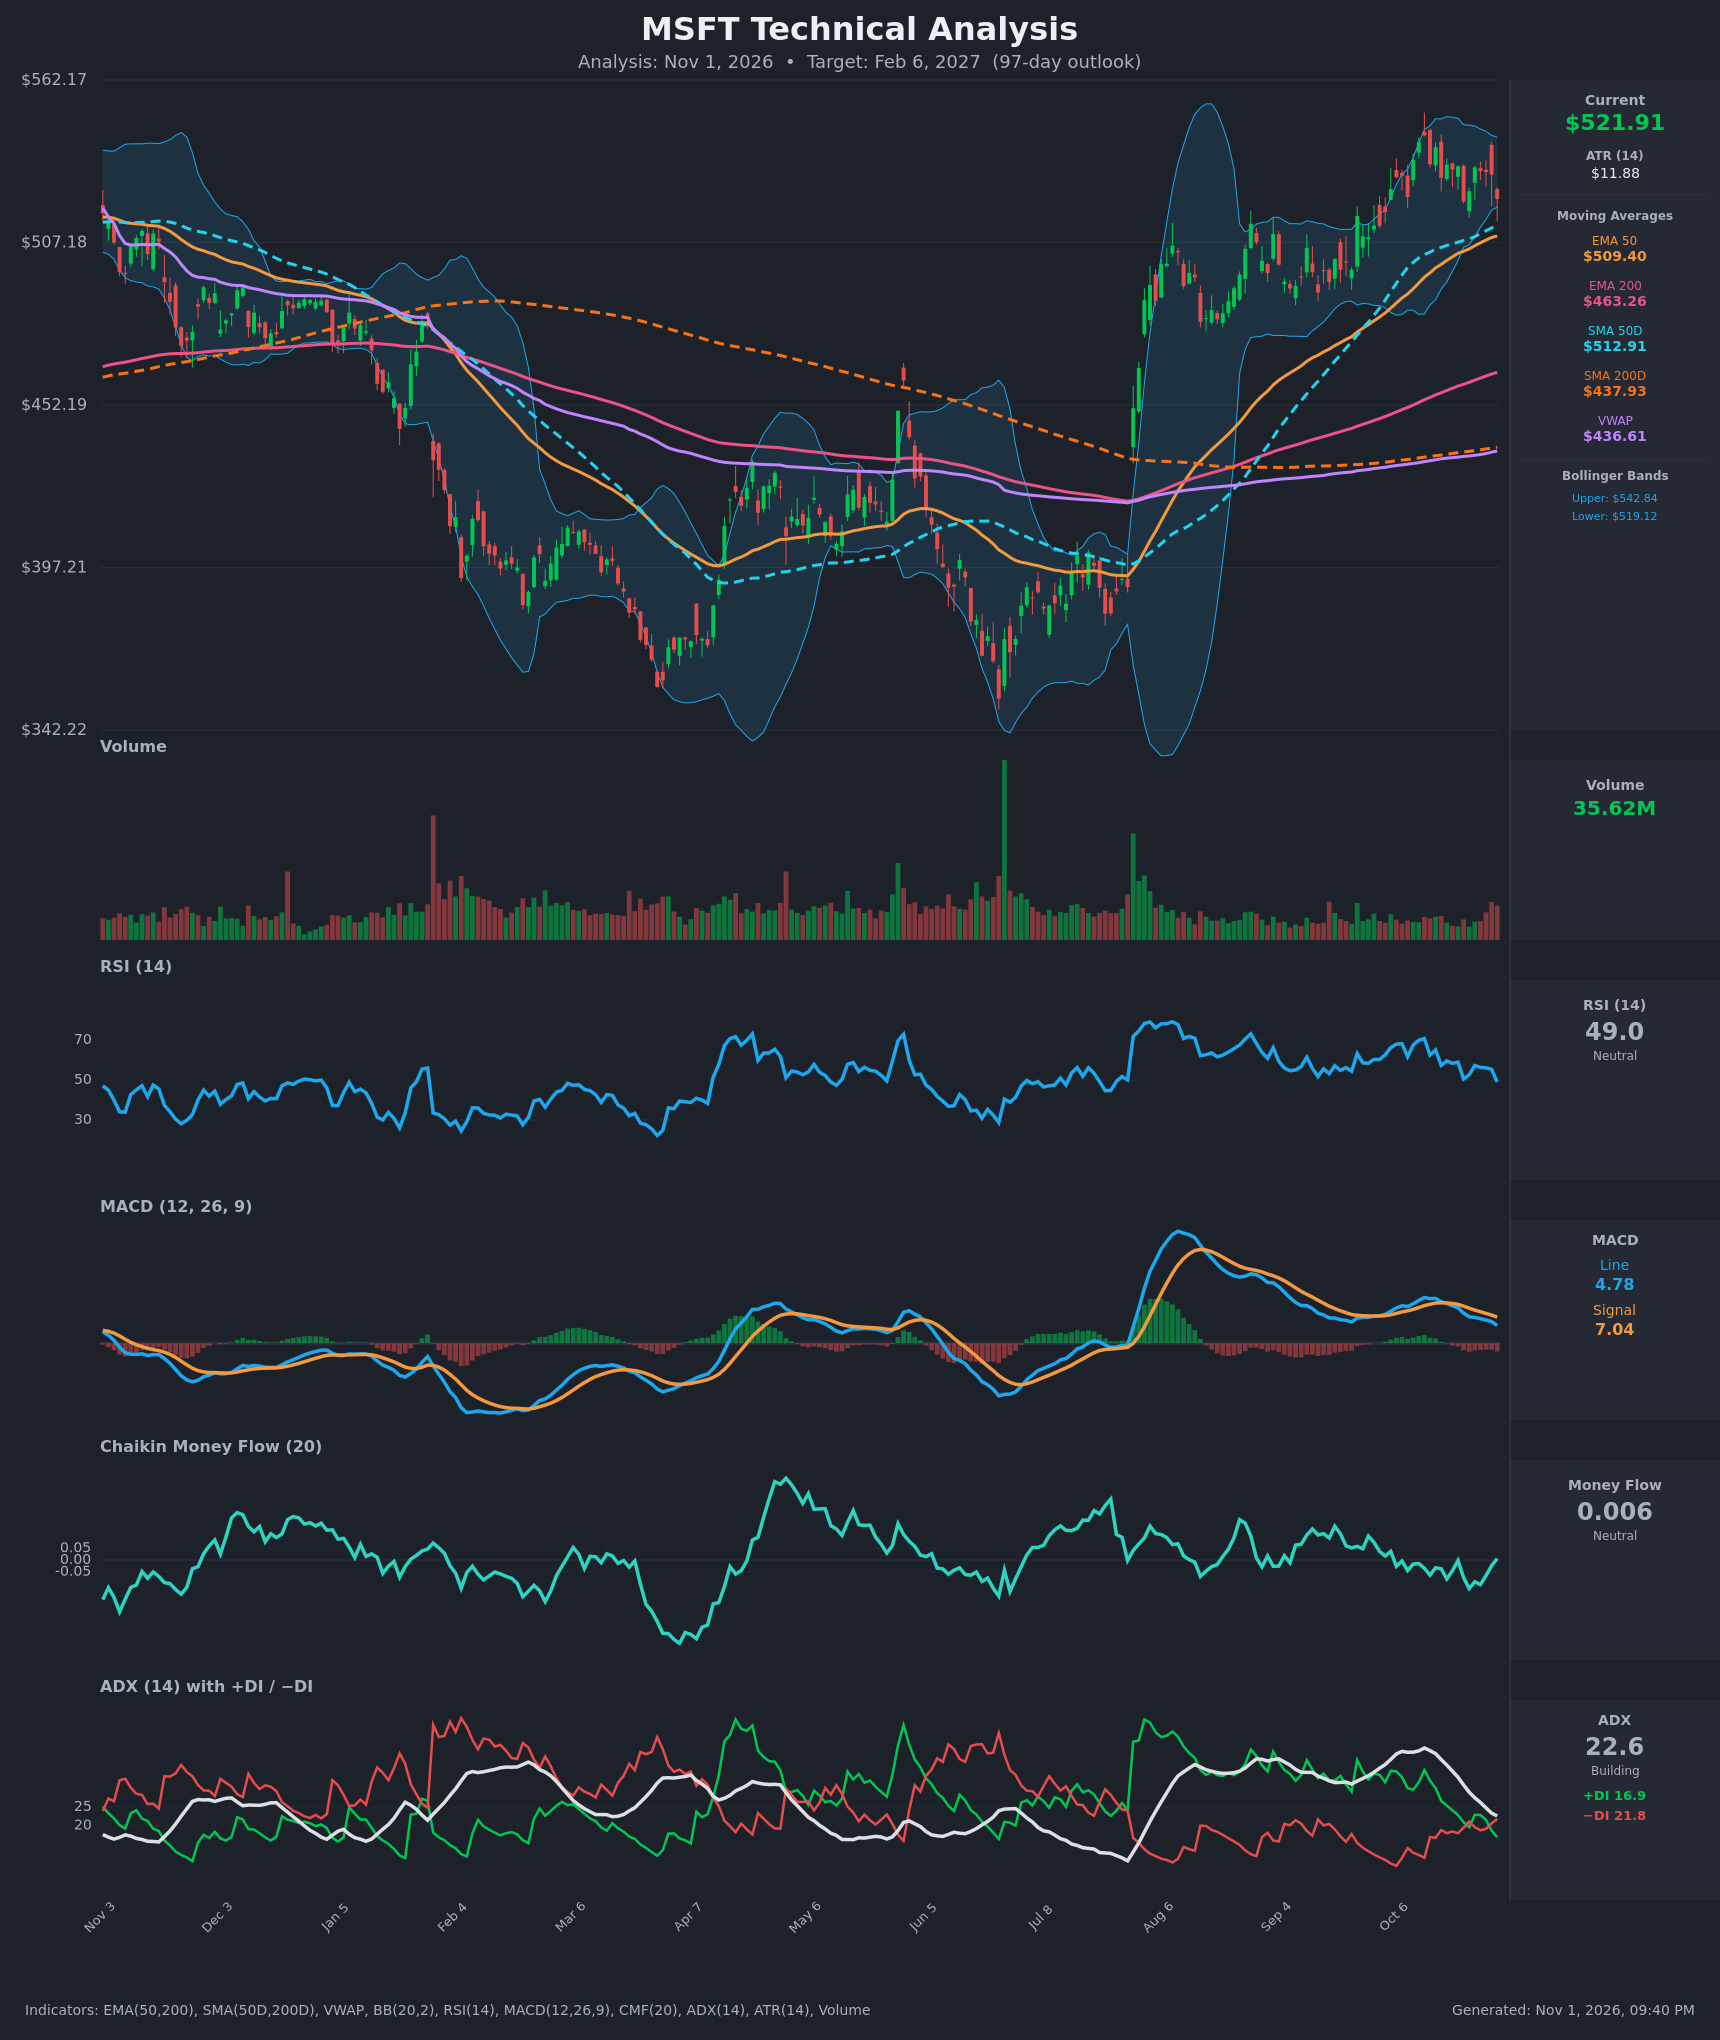
- RSI (14): 49.02, down from 70.7 on Oct 13 and now at the neutral midline. The lower highs since mid-October show fading momentum. [Neutral]
- 20 EMA: The 20 EMA is not supplied. The nearest dynamic supports are the EMA 50 at $509.40 and SMA 50 at $512.91, both rising. Price at $521.91 is above them but has lost the $530 area it held for two weeks. [Neutral]
- MACD: Line 4.78 is below signal 7.04, and the bearish crossover happened around Oct 19. The gap has been widening for roughly 8 sessions, so the histogram is negative and falling. [Bearish]
- Bollinger Bands (20): Upper $542.84, lower $519.12. Price is hugging the lower band after rejection near the upper band on Oct 12-13. The bands are narrowing from the August expansion, which points to consolidation. A close below $519 would be a downside break. [Bearish]
- CMF (20): 0.006, inside the neutral band (±0.05). It was negative for most of October (as low as -0.121) and has only just ticked up to zero. Buying has not been decisive. [Neutral]
- ADX (14): 22.6 and falling from 40.8, so the August-October trend is losing strength. −DI (21.8) has crossed above +DI (16.9), which is a mild bearish tilt. [Weak Trend + bearish lean]
- Volume: 35.62M, near average with a small uptick on the latest down bar. The spike volume seen in July-August is gone, so there is no strong accumulation or capitulation. [Mildly bearish / neutral]
DIVERGENCES & TRENDS
- Price held near $530 through late October while RSI and MACD made lower highs. This is a mild bearish momentum divergence.
- The MACD bearish crossover is confirmed and the line is still falling toward zero.
- The −DI/+DI crossover and the ADX decline from 40 to 22.6 show the trend has matured and is stalling.
- The long-term structure remains bullish. The golden cross is in place (SMA50 $512.91 vs SMA200 $437.93, EMA50 $509.40 vs EMA200 $463.26), and price is far above the 200-day averages and VWAP ($436.61).
- Price is only about 2.5% above the 50-day averages. A pullback test of them would be normal after an extended rally from the ~$350 low.
CHART PATTERNS
- Bearish Double Top (loose): Highs around $541-543 on Oct 12-13 and ~$543 earlier, with a neckline near $519-521. Price is sitting on that neckline. A confirmed break implies a measured move of roughly $20-25 down, to about $497-500.
- Alternative: Symmetrical/range consolidation: The narrowing Bollinger Bands and the ADX below 25 suggest a sideways phase between about $510 and $543 after the August rally. This is a continuation structure if support holds.
- The larger picture is a V-shaped recovery from ~$350 to ~$550 that may now be digesting its gains. The 50-day averages near $510-513 are the key test.
POTENTIAL SCENARIOS
- Scenario 1: Bearish Double-Top Pullback — Price loses the $519 neckline and band support. Momentum is fading, MACD is bearish and −DI leads. Price drifts to test the 50-day averages, possibly undercuts them, and consolidates in the $490-510 area. Trigger: daily close below $519 and then below $509.40. Target: $500, with an extension to $480. Invalidation: a daily close above $543. (45% probability)
- Scenario 2: Bullish Trend Resumption — The 50-day averages hold as support and the golden-cross uptrend resumes. MACD turns back up from near zero and price breaks the $543 highs. Trigger: bounce from $509-513 and a close above $543. Target: $560-575. Invalidation: a close below $500. (35% probability)
- Scenario 3: Neutral Range Consolidation — Price chops between roughly $505 and $545 as ADX stays below 20 and the bands stay narrow. Trigger: failed breaks of both $509 and $543. Target: $515-530. Invalidation: a close outside the $500-$550 range. (20% probability)
PRICE TARGETS
- Target Price: $500.00 (97 days, around Feb 6, 2027)
- Expected Range: $448.00 to $562.00 (width $114, about 21.8% of the current price, in line with the 61-180 day guidance)
- Key Levels: Support at $509.40 (EMA 50, with SMA 50 at $512.91 just above), Resistance at $543.00
OVERALL BIAS
OVERALL BIAS: BEARISH - MACD is below its signal line and falling, −DI has crossed above +DI, ADX is fading, RSI has dropped from 70 to 49, and price is pressing the lower Bollinger Band at a possible double-top neckline. The long-term uptrend keeps the downside moderate, with the rising 50-day averages near $510 as the likely area of support.
This is educational analysis and not financial advice.