NFLX 97-day bearish forecast — Nov 1, 2026
- Bias: Bearish
- Timeframe: 97 days (made Nov 1, 2026, target date Feb 5, 2027)
- Price at analysis: $62.08
- Price target: $58.50
- Expected range: $50.00 – $69.00
- Result: Pending — graded after the close on Feb 5, 2027
Get a free AI analysis of NFLX today
Analysis
TECHNICAL INDICATORS
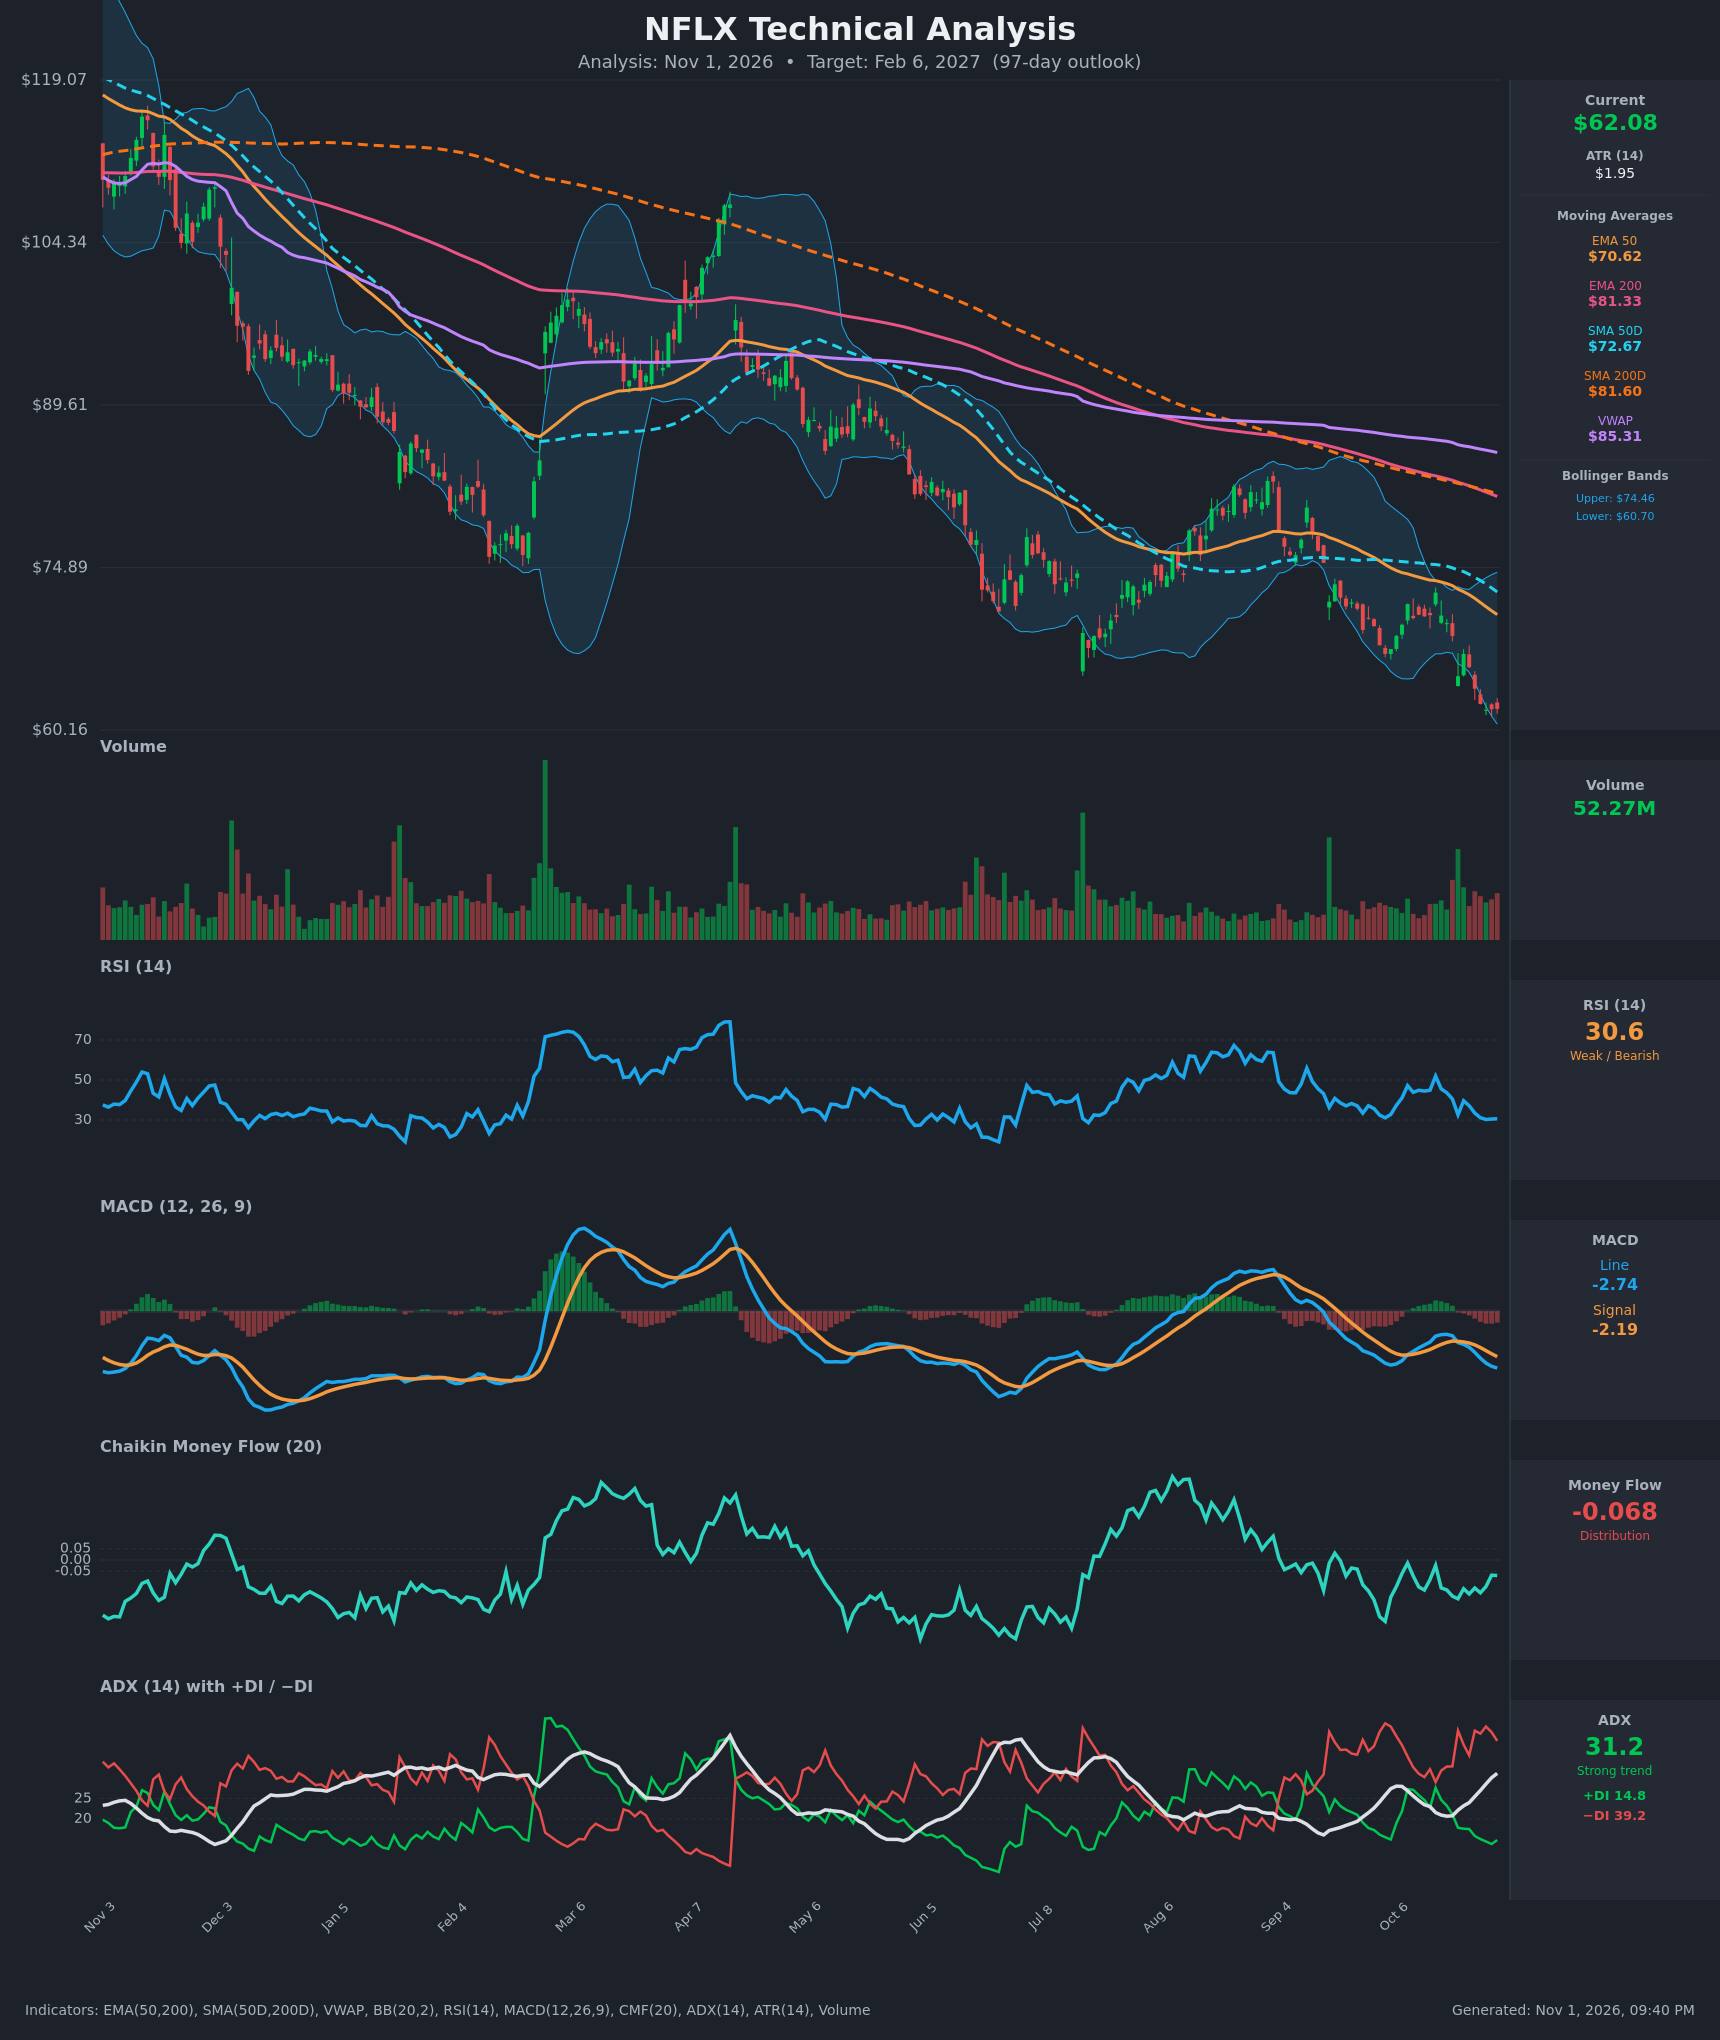
- RSI (14): 30.62, hovering at the oversold threshold after falling from ~52 on Oct 15. It has held at 30-31 for five sessions, so selling momentum is steady rather than accelerating. Prior oversold dips on the chart (Dec, Jan, Jun-Jul) produced only modest bounces inside the downtrend. [Bearish]
- 20 EMA: The 20 EMA isn't supplied. The EMA 50 at $70.62 is a proxy, and price at $62.08 sits about 12% below it. Both the EMA 50 and SMA 50D ($72.67) are sloping down and act as overhead resistance. [Bearish]
- MACD: Line -2.74 is below signal -2.19, with the histogram negative and widening (about -0.55). The bearish crossover occurred around Oct 21 and the gap keeps expanding, so downside momentum is still building. [Bearish]
- Bollinger Bands (20): Price at $62.08 sits near the lower band ($60.70), with the upper band at $74.46. The bands are widening, and price has been walking the lower band. That shows trend continuation more than a reversal, though stretched readings often give a relief bounce. [Bearish]
- CMF (20): -0.068 is below -0.05, indicating mild distribution. It has been negative throughout the decline, with no sign of accumulation. [Distribution]
- ADX (14): 31.2 and rising (from 20.7 on Oct 19), with -DI at 39.2 well above +DI at 14.8. This is a strong, strengthening downtrend with bears in firm control. [Strong Trend - Bearish]
- Volume: 52.27M, elevated versus the typical baseline in recent weeks. The selloff has come with rising volume, which suggests active distribution rather than exhaustion. There is no obvious capitulation spike yet. [Bearish - volume confirms the decline]
DIVERGENCES & TRENDS
- No bullish divergence yet: Price made new lows (~$62) while RSI sits at ~30.6, close to its previous lows around 25-30 in the summer. MACD is making lower lows. Momentum confirms price.
- Moving average structure: EMA 50 ($70.62) < SMA 50D ($72.67) < EMA 200 ($81.33) < SMA 200D ($81.60) < VWAP ($85.31). This is a fully bearish stack. The 50/200 death cross has already occurred and the gap is widening. The EMA 50 and EMA 200 gap has grown from about $9.5 to about $10.7 over the last 15 bars.
- Price vs. SMA200D: Price is about 24% below the 200-day SMA, a firmly established long-term downtrend. Lower highs run from ~$119 to ~$108 (Apr) to ~$84 (Aug) to ~$72 (Oct).
- Mean-reversion risk: Being far below the averages and at the lower Bollinger Band implies a relief rally is plausible. In previous cycles it faded near the EMA 50 and SMA 50D.
- Crossovers: Bearish MACD crossover in force. The DI spread (-DI over +DI) has widened sharply. ADX has turned up through 25.
CHART PATTERNS
- Primary structure: A persistent descending channel of lower highs and lower lows, with price repeatedly rejected at the declining 50-day averages. It is closest to a bearish continuation pattern. The Aug bounce to ~$84 followed by the breakdown resembles a Bearish Rising Wedge / Flag (reference diagram), which resolved to the downside.
- Possible bottoming structure: Lows around $65 (Jul-Aug) and $62 (now) hint at a Double Bottom in the reference diagram. It is not confirmed because price is breaking below the prior low area, and a Double Bottom would need a break above the neckline (~$72-75).
- Targets: Measured moves from the Aug-Oct breakdown (~$84 to ~$75 breakdown level, a ~$9-10 drop) project to ~$56-60 on continuation. A reversal would need a reclaim of ~$72-75 for a ~$85 target.
POTENTIAL SCENARIOS
- Scenario 1: Bearish Trend Continuation — The strong ADX and a bearish MA stack keep the downtrend intact, with brief relief bounces failing at the EMA 50. Trigger: a daily close below $60.16 (the chart low) and the lower Bollinger Band. Target: $54-58, with a possible extension to ~$52. Invalidation: a daily close above $72.70 (SMA 50D). (50% probability)
- Scenario 2: Neutral Base and Range — Oversold conditions fade selling and price consolidates in a $58-$70 range, forming a base. Trigger: RSI holding above 30 with MACD histogram flattening and volume drying up. Target: $60-$68 range-bound. Invalidation: a break below $58 or above $72. (22% probability)
- Scenario 3: Bullish Oversold Reversal — A snap-back rally from the oversold, extended condition toward the declining moving averages. Trigger: a close above $66-67 with a MACD histogram turn and CMF above 0. Target: $72-75 (EMA 50 / SMA 50D, upper Bollinger Band). Invalidation: a failure back under $62. (28% probability)
PRICE TARGETS
For a 97-day horizon (range width should be ~18-30% of price):
- Target Price: $58.50 (about 5.8% below current)
- Expected Range: $50.00 to $69.00 (width $19.00, about 30.6% of current price; this is at the high end of the 18-30% guidance because of the elevated volatility and the two-sided risk of a relief rally)
- Key Levels: Support at $60.16, Resistance at $70.62
OVERALL BIAS
OVERALL BIAS: BEARISH - ADX at 31 with -DI far above +DI, a bearish MACD with a widening histogram, negative CMF, and price well below a fully bearish moving-average stack all point to continued downside. The oversold RSI and lower-band proximity argue for relief bounces that should meet resistance around $70-73, and downside is therefore expected to be modest rather than a collapse.
This is educational analysis and not financial advice.