ORCL 97-day bearish forecast — Nov 1, 2026
- Bias: Bearish
- Timeframe: 97 days (made Nov 1, 2026, target date Feb 5, 2027)
- Price at analysis: $130.67
- Price target: $123.00
- Expected range: $108.00 – $144.00
- Result: Pending — graded after the close on Feb 5, 2027
Get a free AI analysis of ORCL today
Analysis
TECHNICAL INDICATORS
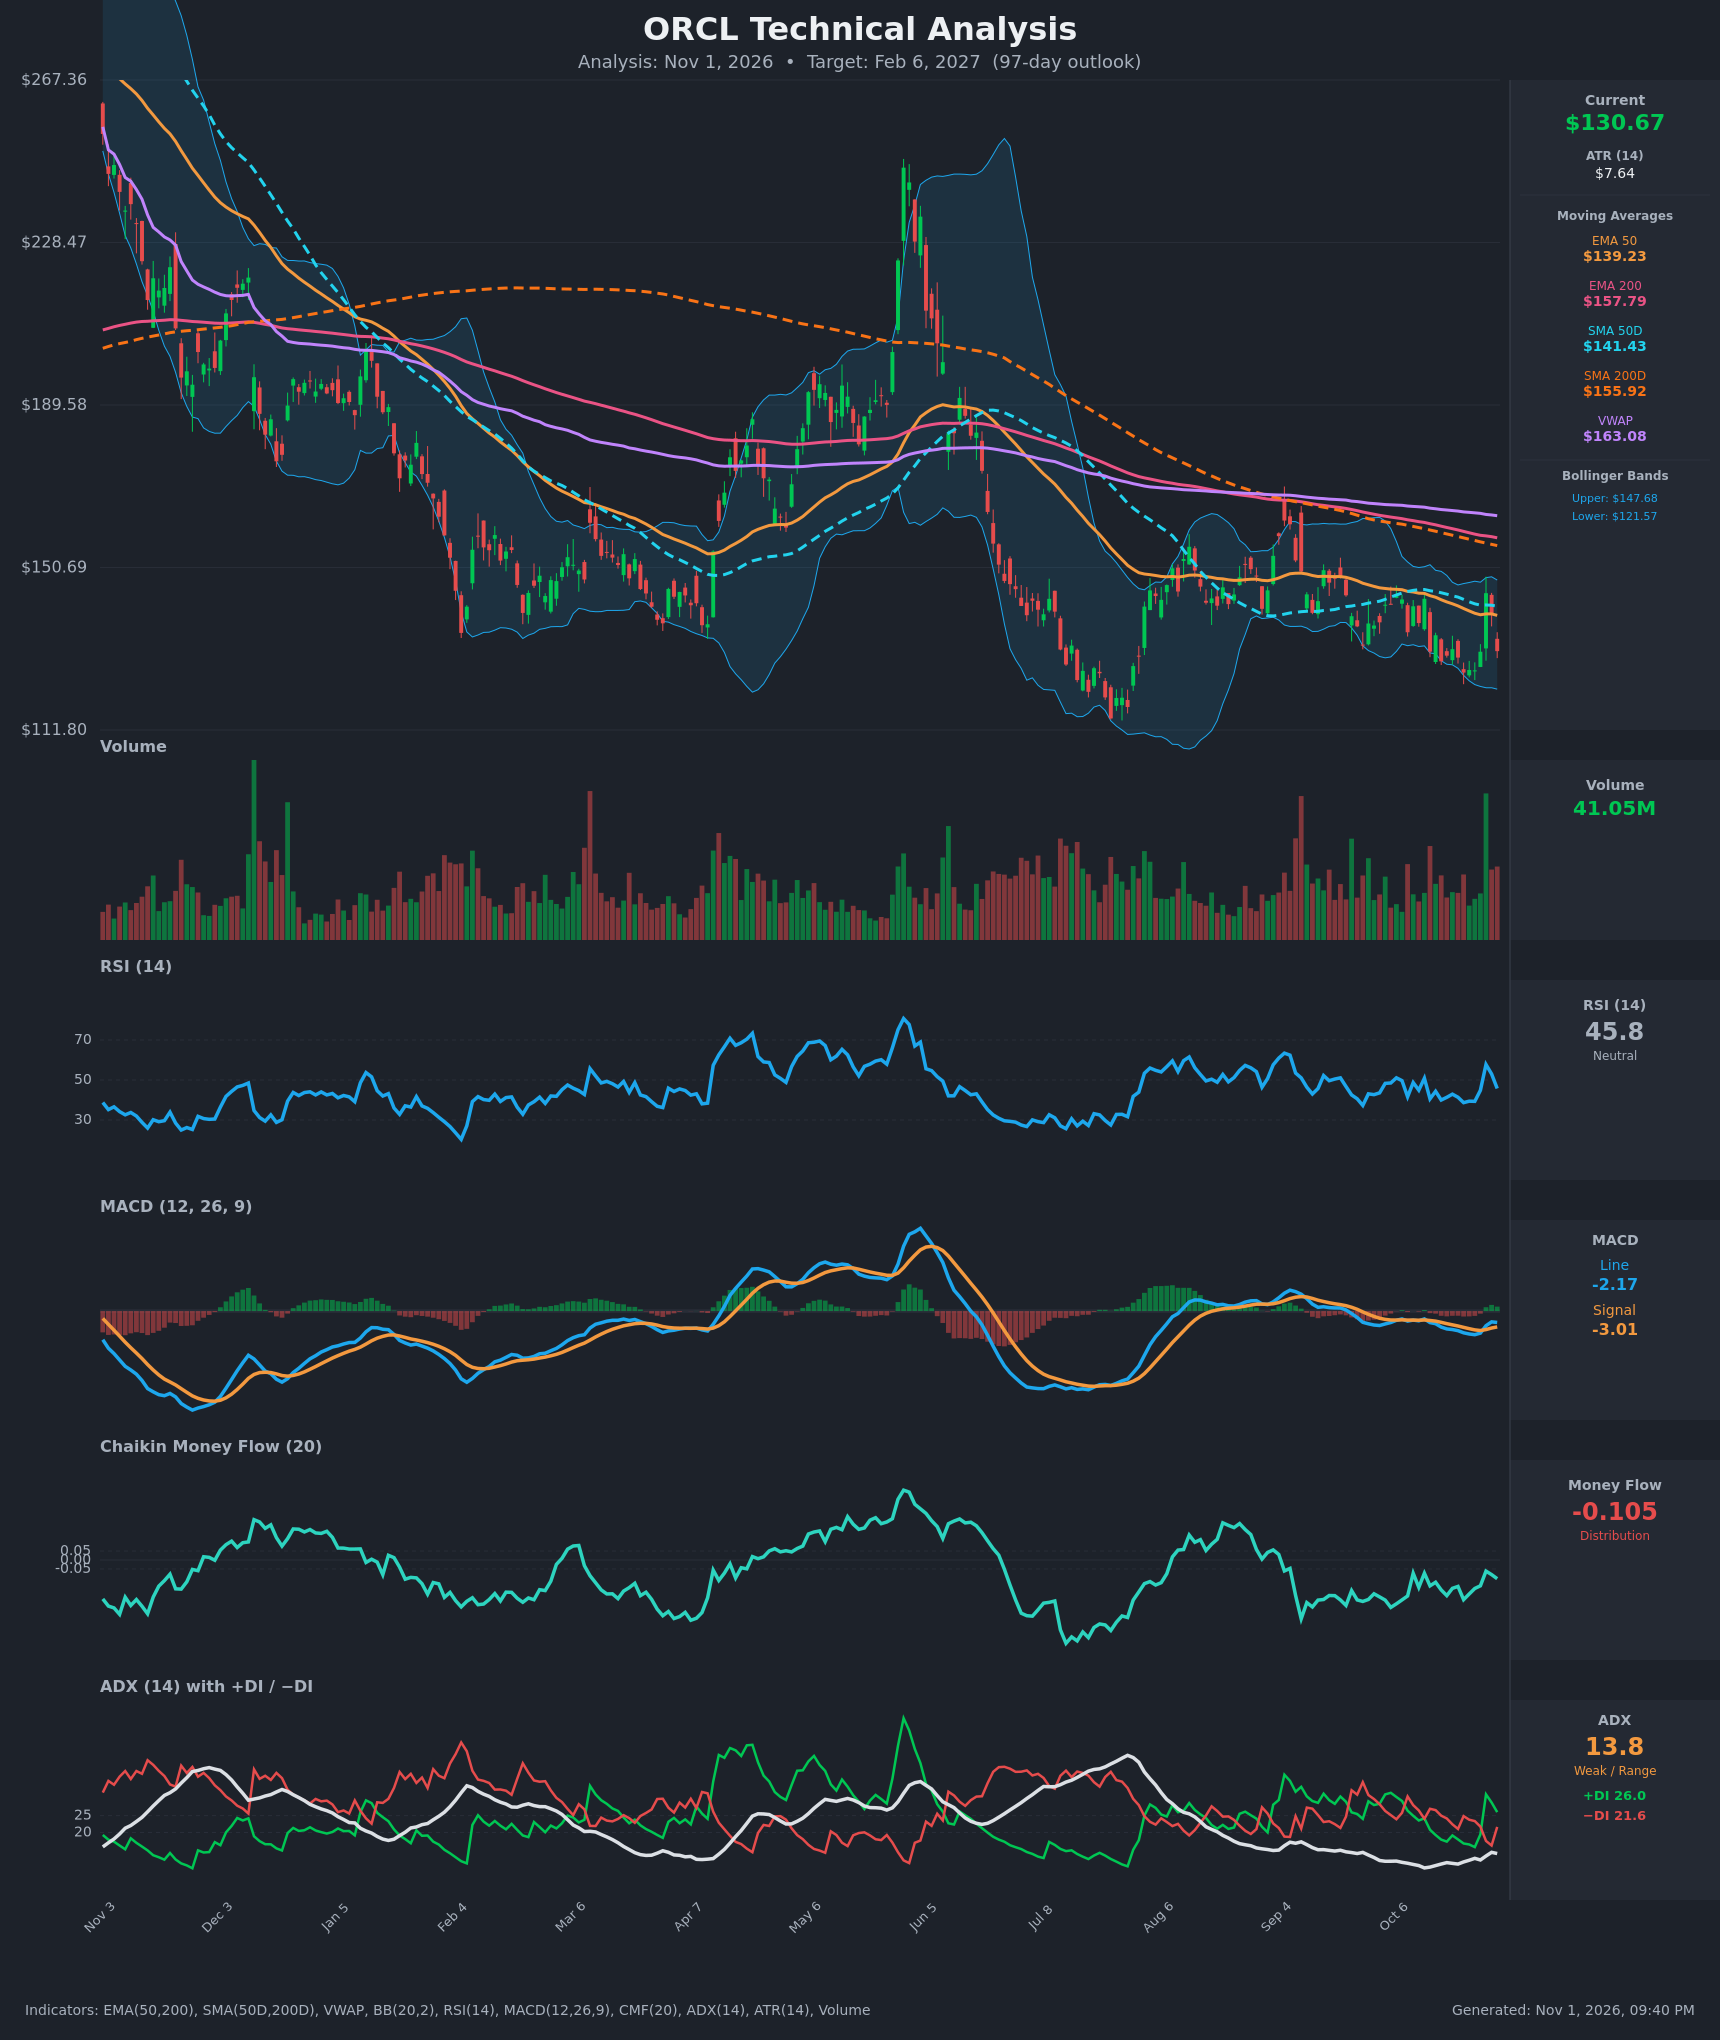
- RSI (14): 45.76, below the 50 midline. It spiked to ~58 on Oct 28 and has since rolled back down, and it has not been oversold or overbought in recent months. Momentum is soft and fading. [Neutral]
- EMA (50/200): EMA 50 is $139.23 and EMA 200 is $157.79. Price at $130.67 is below both, and EMA 50 has stayed under EMA 200 (a bearish alignment) the whole recent period. Both are sloping down, so they act as overhead resistance. (The chart shows no 20 EMA, so the 50 EMA is the closest short-term proxy.) [Bearish]
- MACD: Line -2.17, signal -3.01, histogram slightly positive (+0.85). The line crossed above the signal on Oct 28 after a long bearish stretch, but both remain below zero. This is a weak relief bounce, not a trend change. [Neutral]
- Bollinger Bands (20): Upper $147.68, lower $121.57, middle ~$134.6. Price is just below the midline after a failed push toward the upper band on the Oct 28 spike. The recent range has run along the lower half of the bands, and the bands are narrow, which points to compression. [Bearish]
- CMF (20): -0.105, below the -0.05 threshold. It has been negative for months, with a brief dip to the -0.2 area on Oct 22. This is persistent distribution. [Distribution]
- ADX (14): 13.8 with +DI 26.0 and −DI 21.6. ADX is well below 20, so there is no real trend. +DI is above −DI after the Oct 28 spike, but that is a marginal signal inside a weak-trend environment. [Weak Trend, slight bullish DI tilt]
- Volume: 41.05M, with a large green spike on Oct 28 (the earnings or news pop). It was followed by a quick give-back of most of the gain, which suggests the rally was sold into. [Bearish interpretation]
Price is also below the SMA 50D ($141.43), the SMA 200D ($155.92) and VWAP ($163.08). SMA 50D crossed below SMA 200D earlier (a death cross), and the gap between them is still wide.
DIVERGENCES & TRENDS
- Long-term trend: A persistent downtrend of lower highs and lower lows since the ~$267 peak. Price is far below all long-term averages, with a death cross in place.
- RSI: No clear divergence. RSI held above 30 during the $125–126 lows on Oct 22–26 (it bottomed ~38.7), which is mildly constructive, but the bounce failed at ~58.
- MACD: The histogram flipped slightly positive, but the line is still below zero. The momentum low in late October was lower than the prior low, while price made only a marginal new low. This is a minor positive sign that is yet to be confirmed.
- CMF: Stuck negative with no accumulation. It confirms the selling pressure.
- Failed breakout: The Oct 28 gap-up candle to $144.54 was fully reversed within two sessions ($130.67), which is a bearish reversal signal.
- ADX: Falling to the 10–14 area shows trend exhaustion and a range, not a reversal.
CHART PATTERNS
- Primary pattern: A Bearish Rising Wedge / continuation-type downtrend, expressed as a large multi-month descending channel. Lower highs near $147–150 and repeated tests of the $125–128 floor suggest a slow grind lower.
- Secondary read: Range-bound consolidation between about $122 and $148, which loosely resembles a Descending Triangle (flat support near $125 against lower highs). A break below $125 would project a measured move toward ~$110 or lower.
- Bullish counter-view: A Bullish Double Bottom is possible around $125–126 (Oct 22–26 lows) with a neckline near $144.5 (the Oct 28 high). A close above $145 would be needed to activate it, with a target near ~$163 (the VWAP area).
- The 97-day timeframe gives enough room for either breakout to play out.
POTENTIAL SCENARIOS
- Scenario 1: Bearish Breakdown Continuation — The descending structure resolves lower as price fails at the declining EMA 50 / SMA 50D (~$139–141) and breaks the $125 support zone, with CMF distribution persisting. Trigger: daily close below $124–125 on above-average volume. Target: $110–115. Invalidation: daily close above $145. (45% probability)
- Scenario 2: Neutral Range Consolidation — With ADX under 15, price chops between ~$122 and ~$148 for most of the period, with mean reversion around the $134 midline. Trigger: continued low-ADX trading with no close outside $122–$148. Target: $128–$140. Invalidation: close below $120 or above $148. (30% probability)
- Scenario 3: Bullish Double-Bottom Recovery — Buyers defend $125, and a push through $145 (the Oct 28 high) forces short covering toward the SMA 200D and EMA 200. Trigger: close above $145 with volume and CMF turning positive. Target: $155–163. Invalidation: close below $124. (25% probability)
PRICE TARGETS
For a 97-day timeframe, the width guidance is 18–30% of current price. The expected range runs $108.00 to $144.00, a $36 width, which is 27.5% of $130.67 and in line with the guidance. The bearish and bullish scenarios roughly bracket this range, and the downtrend and persistent distribution tilt the target below the current price.
- Target Price: $123.00 (for the 97-day timeframe, Feb 6, 2027)
- Expected Range: $108.00 to $144.00
- Key Levels: Support at $125.50, Resistance at $139.20
OVERALL BIAS
OVERALL BIAS: BEARISH - Price sits below every major moving average (a death cross is in place), CMF shows persistent distribution, and the Oct 28 spike was sold into immediately. ADX is weak, so the drift lower is likely gradual, with the $125 floor as the key level to watch.
This is educational analysis and not financial advice.