NOK 97-day bearish forecast — Nov 1, 2026
- Bias: Bearish
- Timeframe: 97 days (made Nov 1, 2026, target date Feb 5, 2027)
- Price at analysis: $8.56
- Price target: $8.05
- Expected range: $7.00 – $9.30
- Result: Pending — graded after the close on Feb 5, 2027
Get a free AI analysis of NOK today
Analysis
TECHNICAL INDICATORS
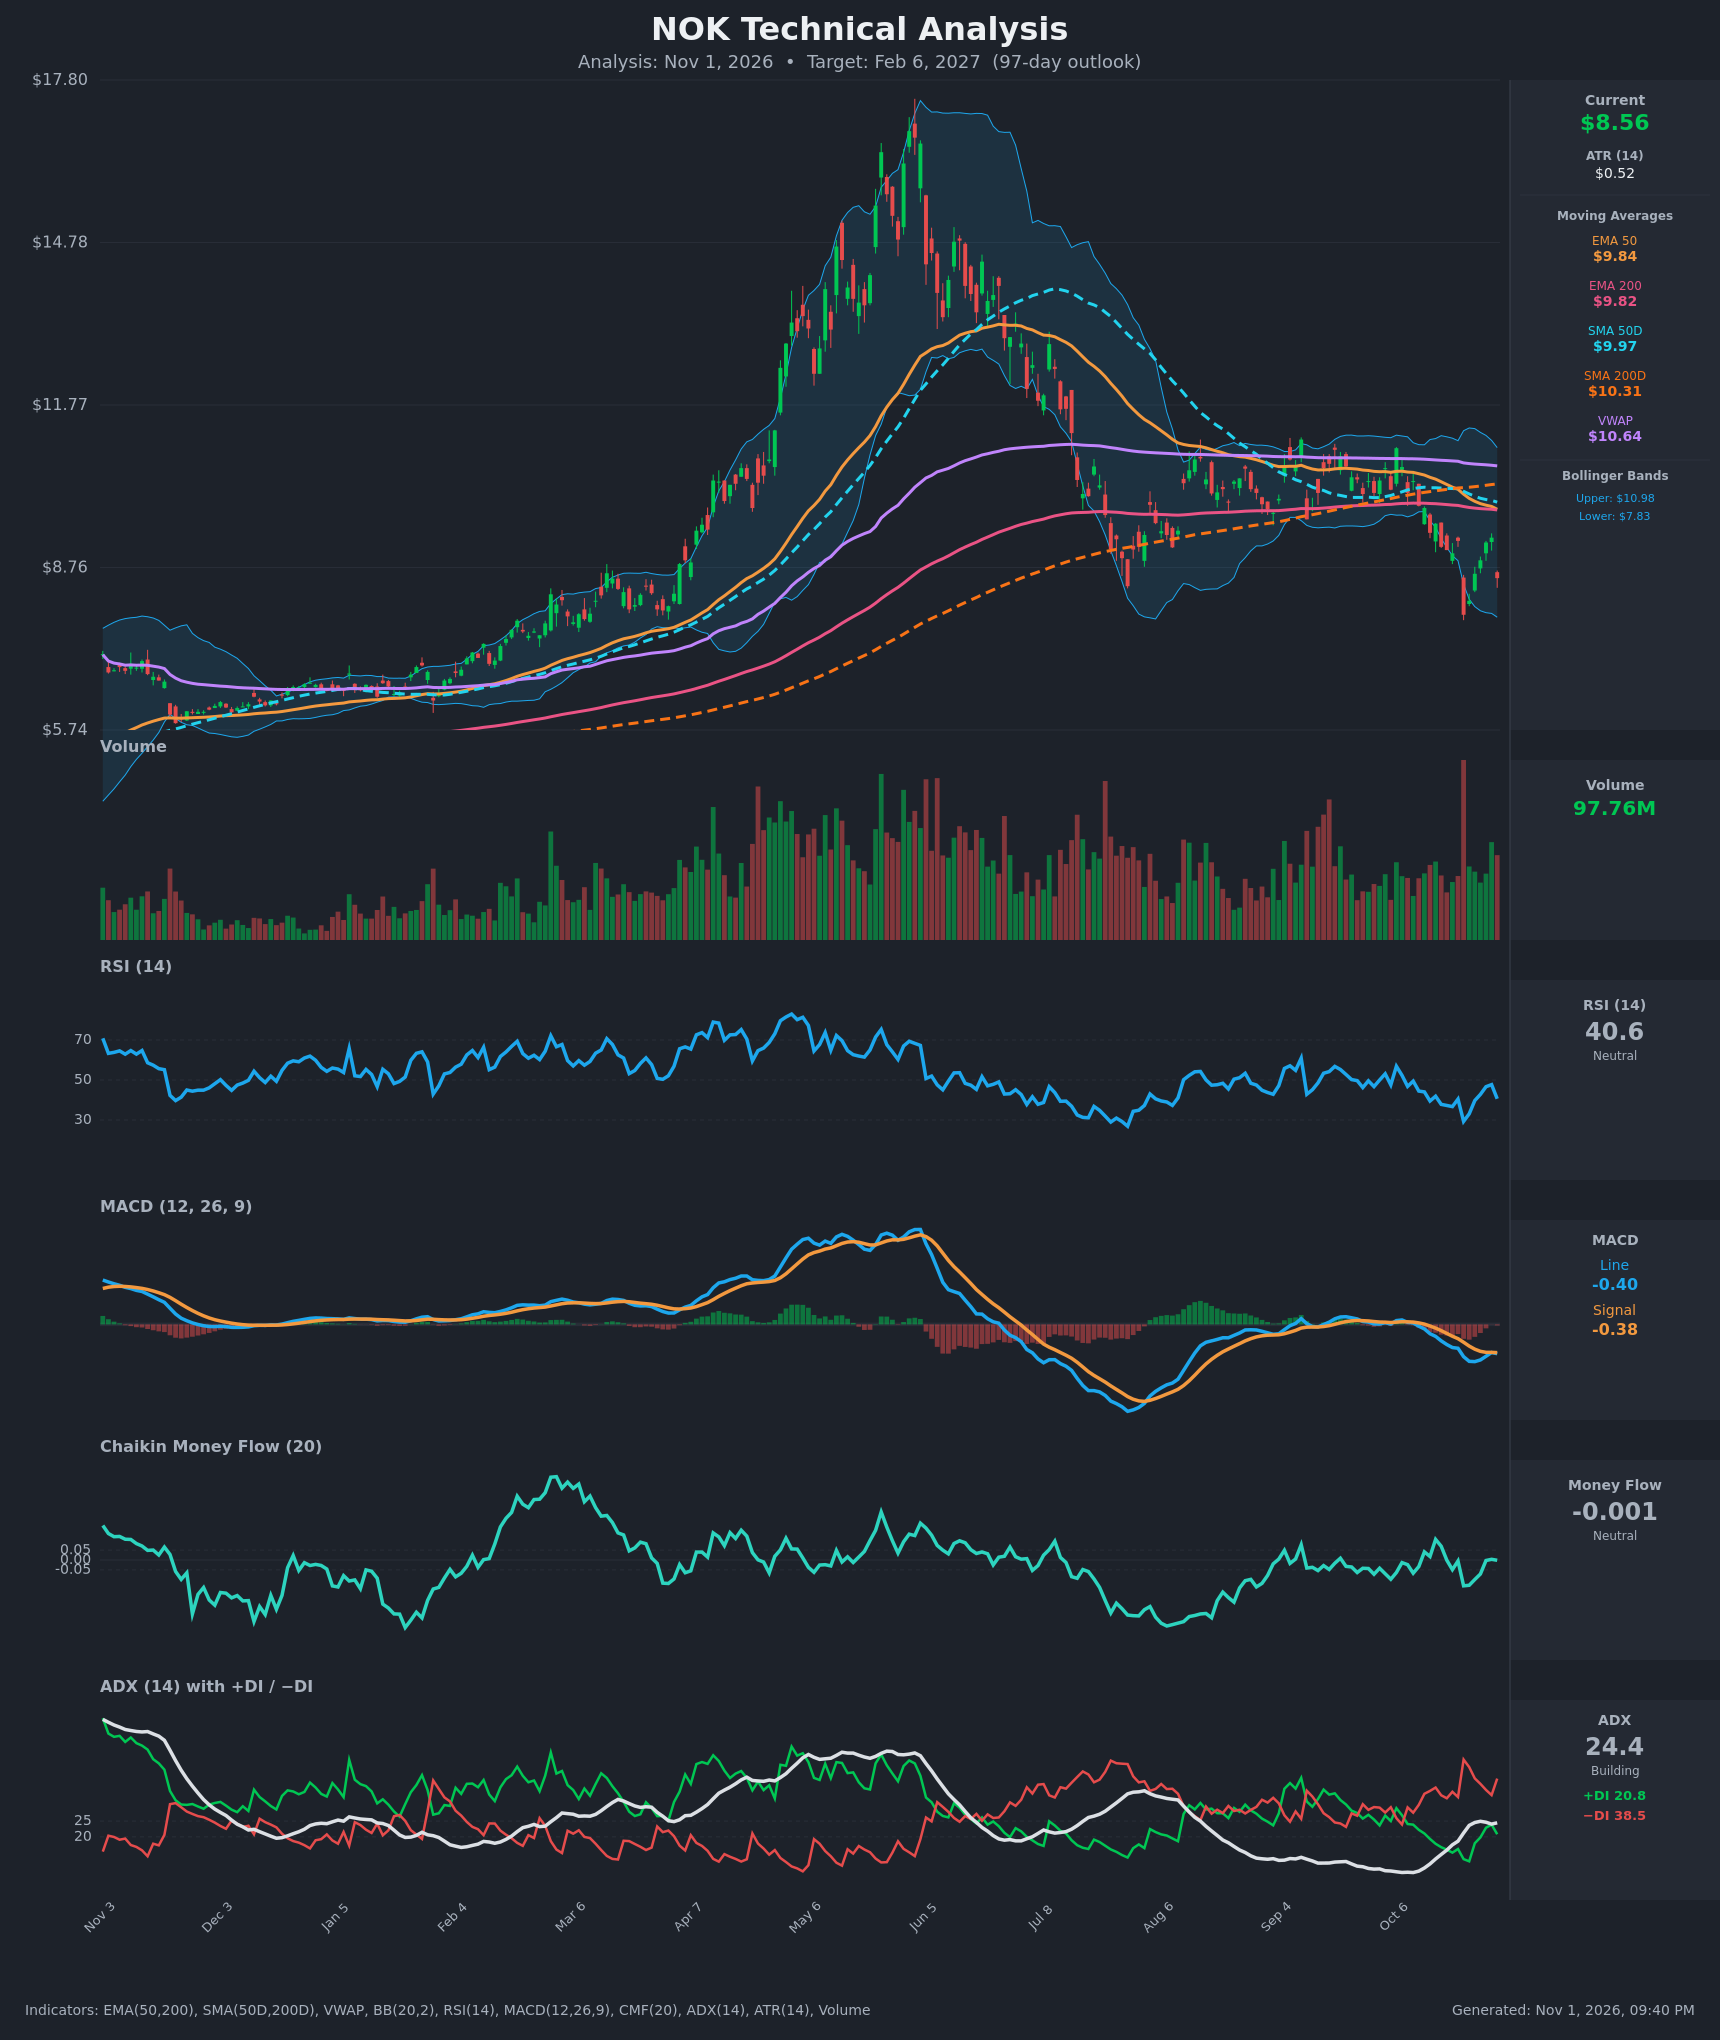
- RSI (14): 40.61, below the 50 midline and recovering from the 29.3 oversold low on Oct 22. The bounce to 47.7 on Oct 29 failed, and RSI turned back down on the Oct 30 drop (-8%). Momentum is weak but not oversold. [Bearish]
- 20 EMA: The 20 EMA is not supplied, so I use the Bollinger midline (20-period SMA) as a proxy at about $9.41. Price at $8.56 is well below it, and the shorter average is acting as resistance. Price is also below EMA50 ($9.84), EMA200 ($9.82), SMA50D ($9.97), SMA200D ($10.31) and VWAP ($10.64). [Bearish]
- MACD: Line -0.3955 is below signal -0.3813, with a slightly negative histogram of about -0.014. The line was nearly touching the signal on Oct 29, then rolled over again. Both lines are below zero, so the structure is bearish with no bullish crossover in place. [Bearish]
- Bollinger Bands (20): Upper $10.98, lower $7.83, midline about $9.41. Price sits in the lower third of the bands after tagging the lower band area on Oct 22 ($7.88). The bands are wide, which means elevated volatility, and there is no squeeze. A rejection from the midline is bearish. [Bearish]
- CMF (20): -0.001, inside the neutral band (±0.05). It has been flat to slightly negative since the Oct 22 selloff (-0.13), so selling pressure has faded but there is no accumulation. [Neutral]
- ADX (14): 24.4, just under the 25 threshold and turning up from a very low 9.2 earlier in October, so a trend is building. −DI (38.5) is far above +DI (20.8), so bears are in control. [Strong/Building Trend – Bearish]
- Volume: 97.76M, elevated. The sharp Oct 22 drop came on a very large red volume spike, which suggests institutional distribution or capitulation. The bounce volume was only moderate, and the latest red bar adds to the selling pressure. [Bearish – heavy volume on down moves]
DIVERGENCES & TRENDS
- Divergences: No clear divergence. RSI made a higher low (29.3 to a retest near 30–40) versus the price low of $7.88, but the Oct 30 drop to $8.56 is still above that low, so this is not a confirmed bullish divergence.
- Death cross is in force: SMA50D ($9.97) is below SMA200D ($10.31), a major long-term bearish signal. EMA50 ($9.84) is only just above EMA200 ($9.82) and is converging fast (the gap narrowed from $0.55 to $0.02 in 15 bars). A bearish EMA death cross is imminent.
- MACD: Bearish since Oct 14. The Oct 28–29 attempt to cross up failed, and the line has turned back below the signal.
- DI and ADX: −DI has dominated +DI for the whole 15-bar window. ADX is rising from 9 to 24, which confirms a developing downtrend.
- Long-term structure: The rally from about $6 to a peak near $17 (June) was followed by a full retracement to $8–9. Price is now below the August–October consolidation zone ($9.4–$10.5), which has flipped from support to resistance.
CHART PATTERNS
- Bearish Flag / Pennant (continuation): The sharp drop on Oct 22 ($9.25 to $7.88) was the pole. The partial rebound to about $9.31 was the flag, and the Oct 30 rejection suggests the flag is breaking down. The measured move (pole about $1.37) from the roughly $8.9–9.3 flag area points to about $7.5–7.9.
- Range breakdown (Bearish Triple-Top-like distribution): The August–October sideways range between about $9.4 and $10.8 failed to the downside. A retest of that zone from below is acting as resistance.
- Larger picture: A rounded top and long retracement from $17. A break below $7.88 would open a path toward the $6.5–7.0 area, where the prior base and the January–March consolidation sit.
POTENTIAL SCENARIOS
- Scenario 1: Bearish Flag Breakdown Continuation — Price fails to reclaim the moving-average cluster and rolls over into the death-cross environment, with −DI dominant and ADX rising above 25. Trigger: daily close below $8.20 and then below the $7.88 Oct 22 low. Target: $7.00–$7.50, with a possible extension to $6.80. Invalidation: daily close above $9.35, then above EMA50 ($9.84). (50% probability)
- Scenario 2: Bullish Oversold Rebound — Price holds the $7.88 area as a higher low, RSI forms a bullish divergence, and a short-covering rally retests the moving-average cluster. Trigger: close above $9.31 with MACD crossing up. Target: $9.80–$10.30 (EMA50/200, SMA50D, SMA200D). Invalidation: close below $7.88. (30% probability)
- Scenario 3: Neutral Range Chop — Price consolidates between $7.88 and $9.30, with CMF near zero and ADX stalling. Trigger: failure of both the breakdown and the rebound. Target: $8.30–$8.90. Invalidation: close outside the $7.80–$9.40 range. (20% probability)
PRICE TARGETS
For a 97-day horizon, the ATR of $0.52 implies a wide spread of outcomes. The range is $7.00 to $9.30, a $2.30 width, or about 26.9% of the current price. That sits within the 18–30% guidance for 61–180 days.
- Target Price: $8.05 (97 days, about 6% below current)
- Expected Range: $7.00 to $9.30
- Key Levels: Support at $7.88, Resistance at $9.31
OVERALL BIAS
OVERALL BIAS: BEARISH - Price is below every major moving average and VWAP, a death cross (SMA50D below SMA200D) is in place, and the EMA50/EMA200 bearish cross is imminent. −DI (38.5) is far above +DI (20.8) with ADX rising, MACD is below its signal, and a bearish flag after the heavy-volume Oct 22 break points to a retest of $7.88 and possibly lower. The modest downside target reflects oversold bounce risk.
This is educational analysis and not financial advice.