NVDA 97-day bullish forecast — Nov 1, 2026
- Bias: Bullish
- Timeframe: 97 days (made Nov 1, 2026, target date Feb 5, 2027)
- Price at analysis: $204.64
- Price target: $216.00
- Expected range: $190.00 – $236.00
- Result: Pending — graded after the close on Feb 5, 2027
Get a free AI analysis of NVDA today
Analysis
TECHNICAL INDICATORS
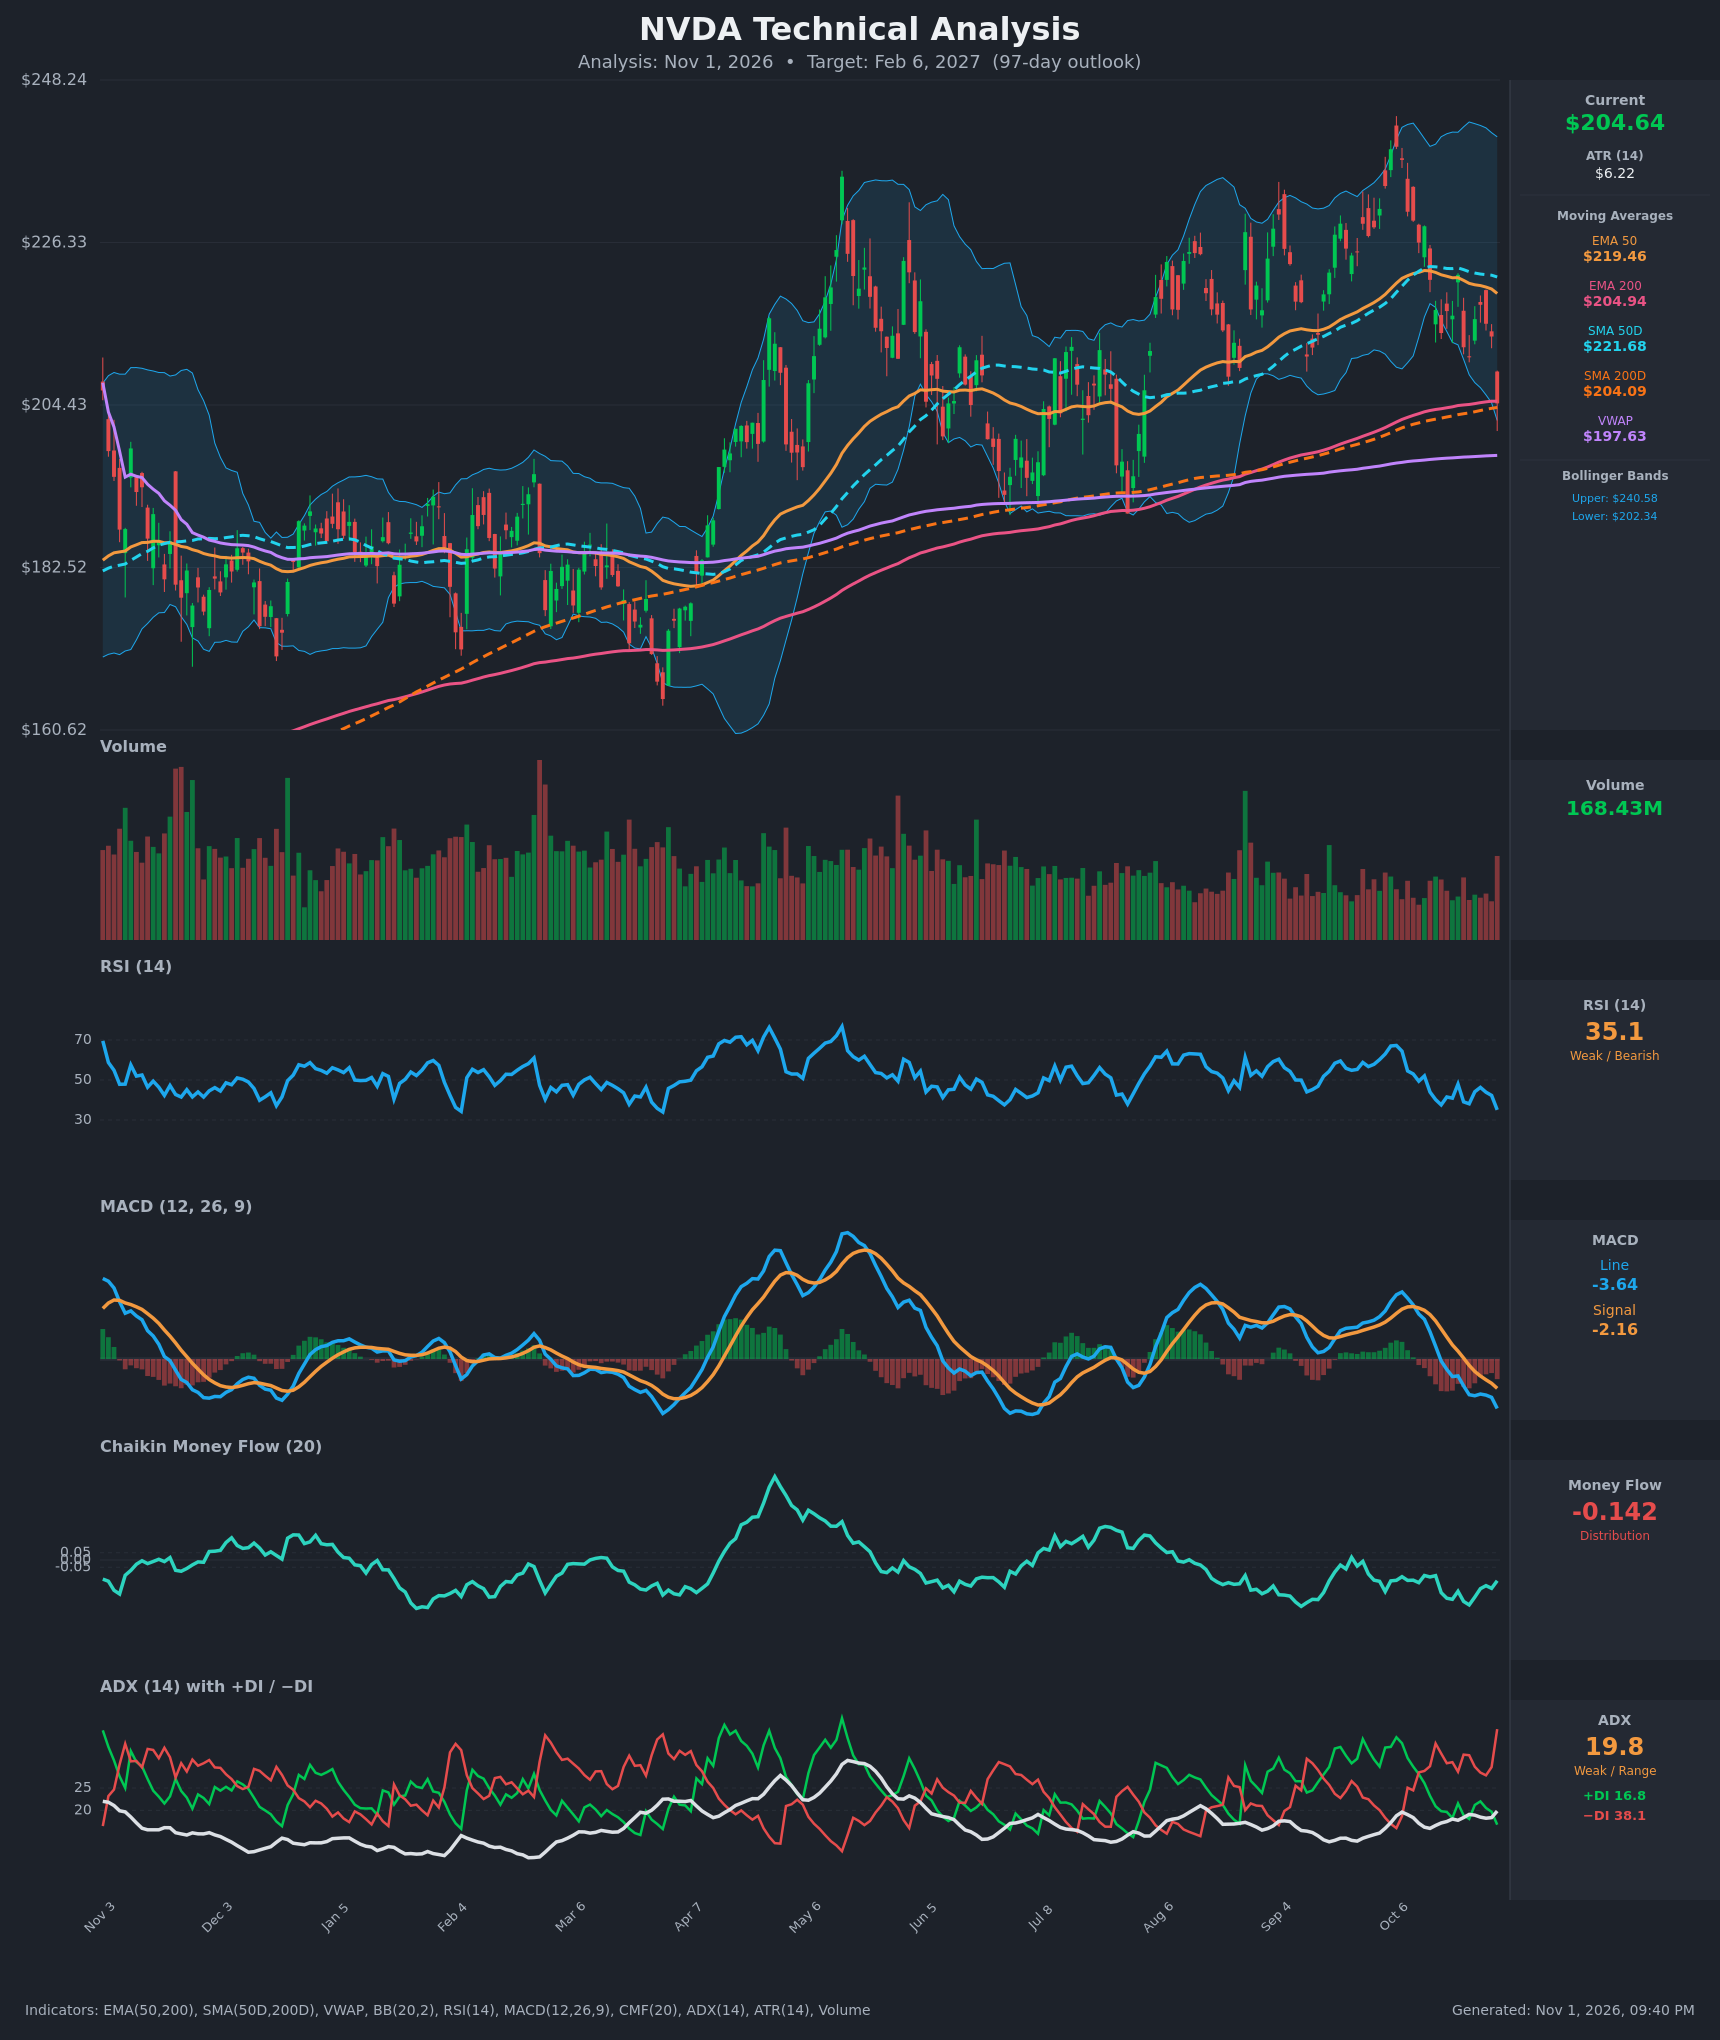
- RSI (14): 35.07, down from 52 on Oct 13 and near the oversold line. It has made lower lows through the pullback (49 → 40 → 35). It is not yet oversold, but selling pressure is stretched. [Bearish]
- 20 EMA: Not supplied. The 50 EMA ($219.46) is a proxy: price is about 6.7% below it and below the SMA50D ($221.68), so the mid-term averages act as overhead resistance. [Bearish]
- MACD: Line -3.64 is below Signal -2.16, with the histogram negative and widening. The bearish crossover came around Oct 16. The line is at its lowest in the recent run and has no sign of turning yet. [Bearish]
- Bollinger Bands (20): Upper $240.58, lower $202.34. Price at $204.64 is hugging the lower band, with the bands still fairly wide. The band walk lower often precedes a snap-back toward the midline (~$221), but it can also continue if support fails. [Neutral]
- CMF (20): -0.142, below the -0.05 threshold and drifting lower through October (-0.10 → -0.31 → -0.14). This is persistent distribution. [Distribution]
- ADX (14): 19.8 with −DI 38.1 far above +DI 16.8. Bears control direction, but ADX below 20 means the trend is not yet strong. The −DI spike suggests a sharp down-leg is under way. [Weak Trend, Bearish direction]
- Volume: 168.43M on the latest bar, a pickup versus the muted volume of the prior weeks, on a red candle. The last bar's heavy volume is consistent with a capitulation-style flush into support. [Bearish short-term, possible washout]
Moving-average context:
- Price is sitting on the EMA200 ($204.94) and SMA200D ($204.09), the key long-term trend support. It is also above VWAP ($197.63).
- Both 200-period averages are still rising, and the EMA50 and SMA50D are well above them. There is no death cross, so the long-term uptrend is intact.
DIVERGENCES & TRENDS
- No clear bullish RSI or MACD divergence yet. RSI and MACD are making new lows in step with price, so momentum confirms the decline.
- Price is falling toward a confluence of the EMA200 and SMA200D. In April and July–August, tests of these averages produced strong rallies.
- The MACD bearish crossover is about two weeks old and is widening. Both the RSI and −DI moves look extended in the short term.
- The 50-day averages are rolling over (EMA50 down from $222.55 to $219.46), but they are still above the 200s.
- The structure is a series of higher lows (≈$163 → ≈$190 → ≈$202), and a break below ~$200 would damage it.
- CMF has been negative for most of the year, even during rallies. This is a persistent warning that rallies lacked buying support.
CHART PATTERNS
- Broad range with higher lows (ascending-triangle-like): Resistance sits near $240 and rising support runs through the 200-day averages. A hold of ~$200 keeps this constructive, with a measured target near the upper range.
- Pullback within an uptrend (falling-wedge or flag style): The October decline from ~$242 to ~$205 is a corrective channel. A bounce off the 200-day confluence would resemble a Bullish Falling Wedge or Flag resolution, with a target at the EMA50/SMA50D zone ($219–222) and then the prior highs.
- Bearish alternative (Head and Shoulders / Double Top risk): The October peak (~$242) followed the May peak (~$232). A clean close below ~$200 would open a move toward $182–190, the prior range support.
POTENTIAL SCENARIOS
- Scenario 1: Bullish Bounce off the 200-Day Support — Price holds the EMA200/SMA200D confluence ($204) and mean-reverts toward the 50-day averages as RSI recovers from near-oversold. Trigger: a daily close back above ~$211 with MACD histogram contraction. Target: $217–$222 (EMA50/SMA50D), with an extension toward $235. Invalidation: a daily close below $198. (50% probability)
- Scenario 2: Bearish Breakdown of Long-Term Support — The −DI dominance and distribution continue, price loses the 200-day averages and VWAP, and the higher-low structure fails. Trigger: a daily close below $198 on rising volume. Target: $182–$190 (prior range lows), with an extreme at ~$175. Invalidation: a reclaim of $212. (35% probability)
- Scenario 3: Neutral Range Chop — Weak ADX keeps price oscillating between the 200-day averages and the 50-day averages. Trigger: repeated closes between $200 and $220. Target: $205–$215. Invalidation: a break outside $196–$222. (15% probability)
PRICE TARGETS
- Target Price: $216.00 (97-day horizon)
- Expected Range: $190.00 to $236.00 (width $46, about 22.5% of the current price, consistent with the 18–30% guidance for 61–180 days)
- Key Levels: Support at $197.63 (VWAP, with the 200-day averages at ~$204 as the first line), Resistance at $219.46 (EMA50, with the SMA50D at $221.68 just above)
OVERALL BIAS
OVERALL BIAS: BULLISH - Price has pulled back into the rising 200-day EMA/SMA confluence with RSI near 35 and the lower Bollinger Band touched. The long-term uptrend and higher-low structure remain intact, so over 97 days a mean-reversion move toward the 50-day averages (~$216–$222) is more likely than a breakdown. Short-term momentum, CMF and DI are all bearish, so a close below ~$198 would invalidate this call.
This is educational analysis and not financial advice.