PLTR 97-day bearish forecast — Nov 1, 2026
- Bias: Bearish
- Timeframe: 97 days (made Nov 1, 2026, target date Feb 5, 2027)
- Price at analysis: $184.11
- Price target: $172.00
- Expected range: $152.00 – $196.00
- Result: Pending — graded after the close on Feb 5, 2027
Get a free AI analysis of PLTR today
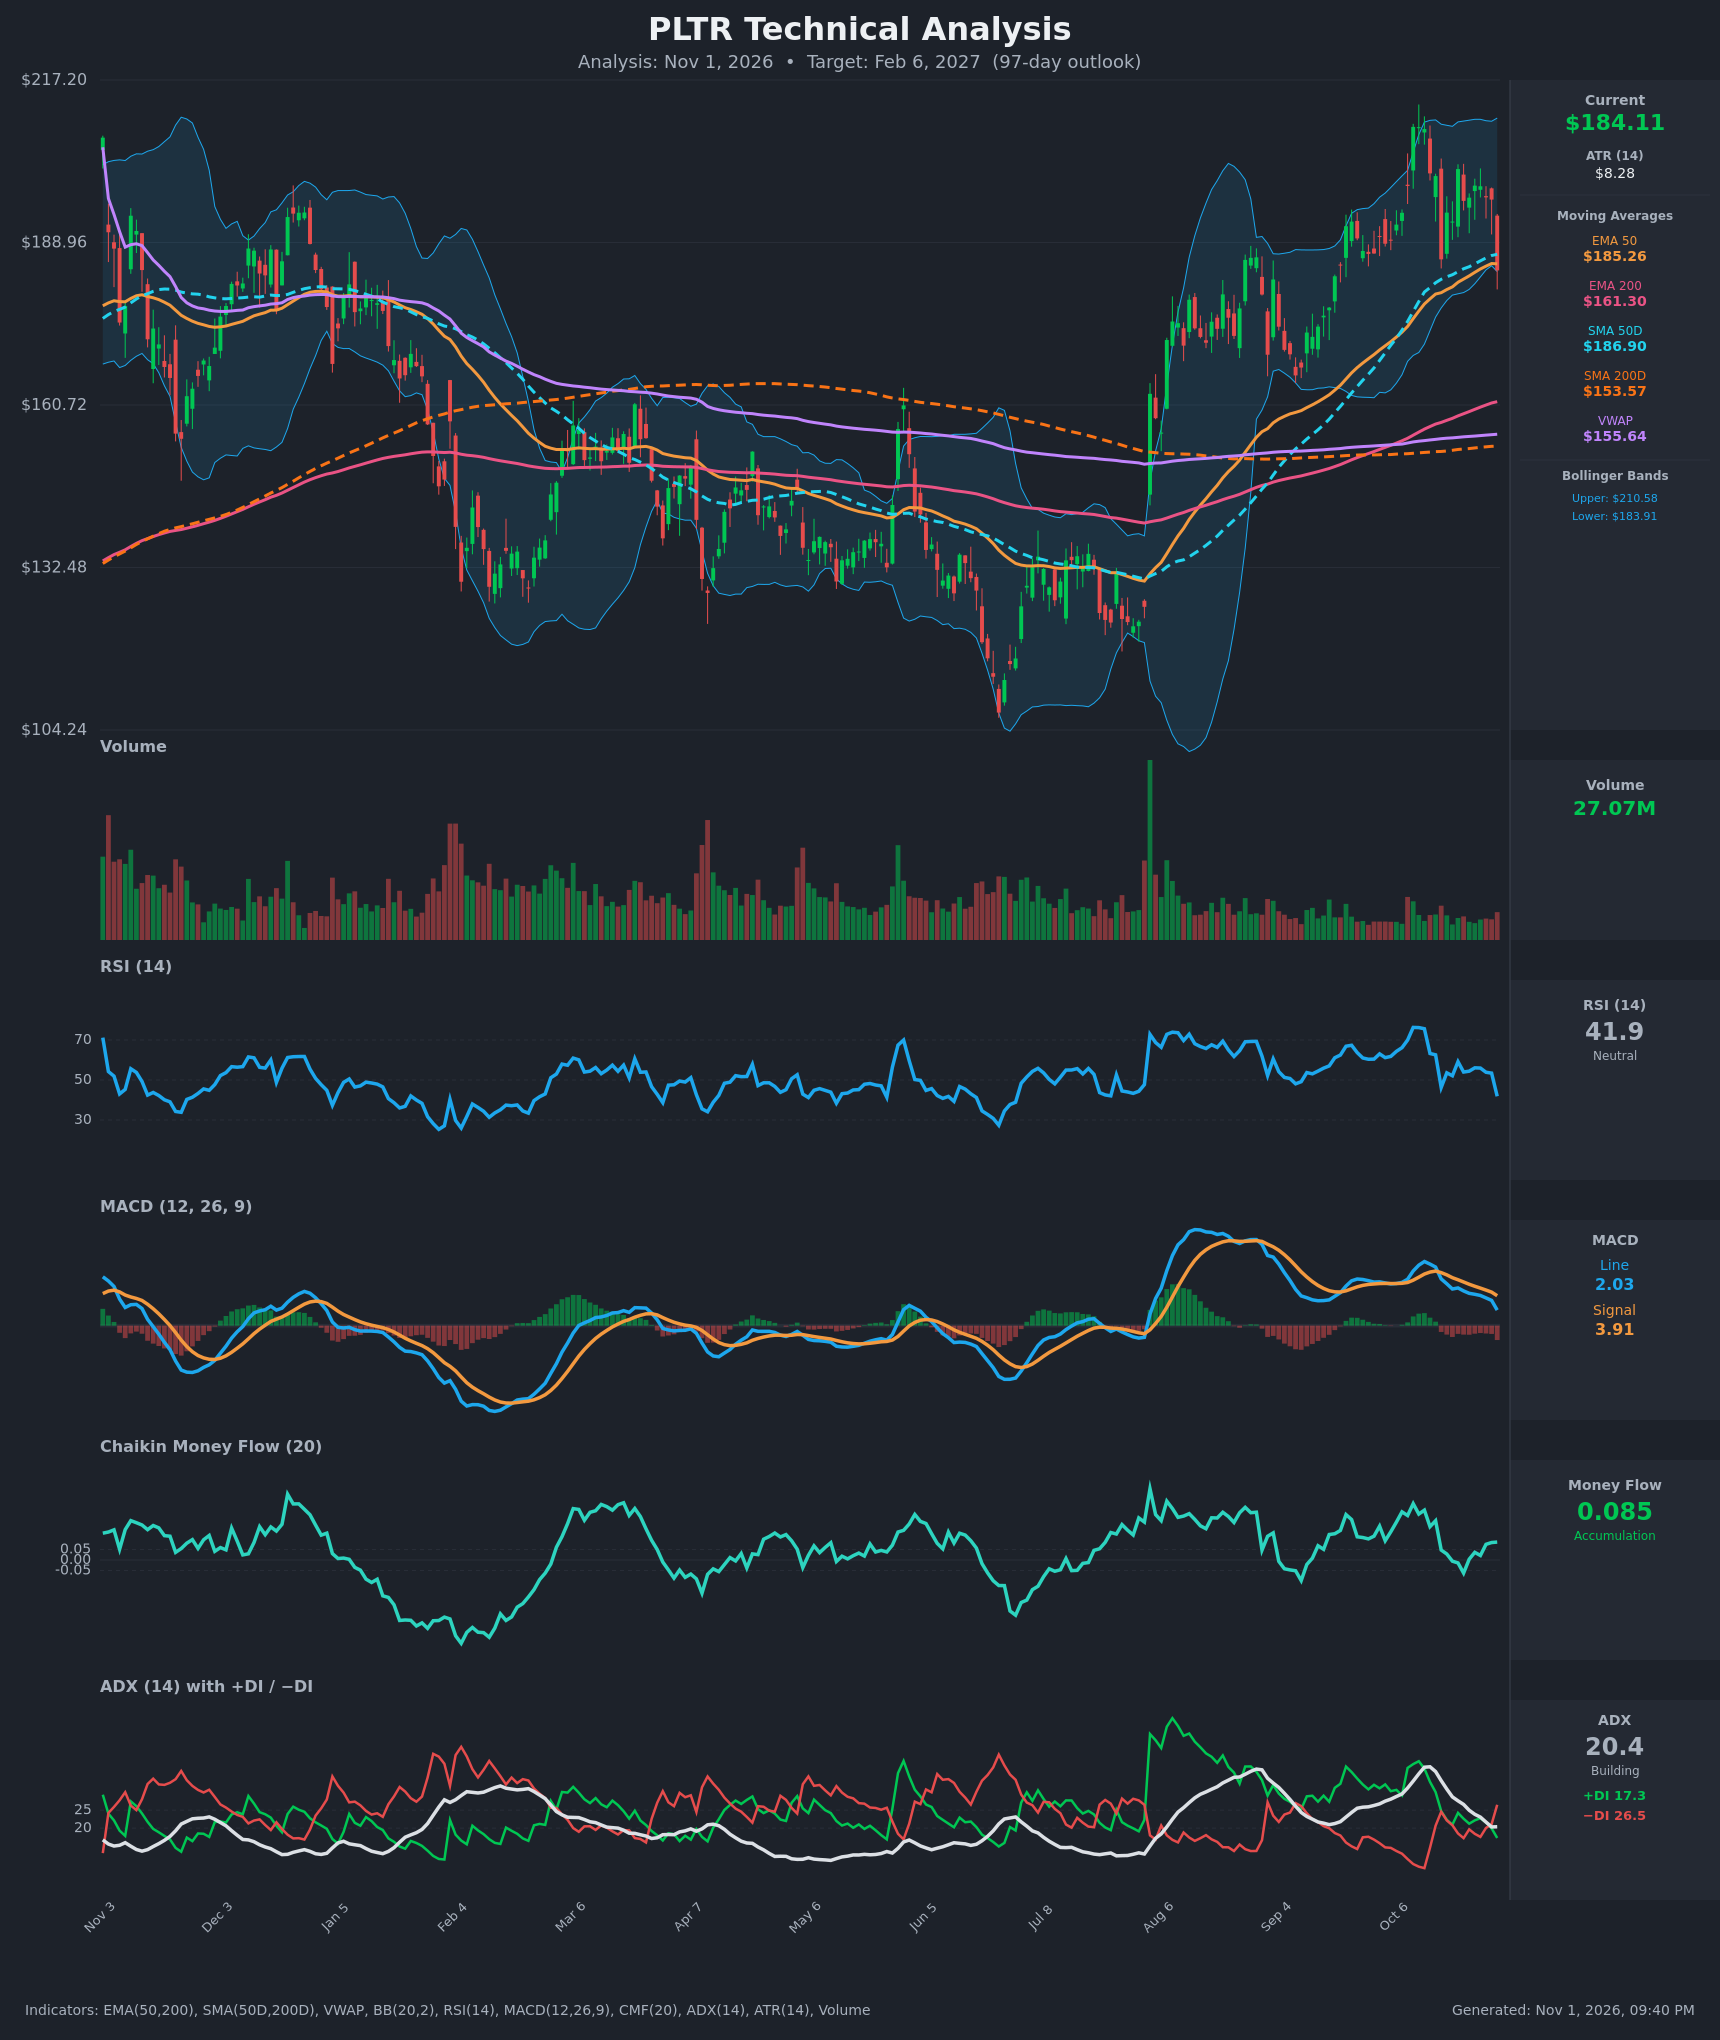
Analysis
TECHNICAL INDICATORS
- RSI (14): 41.86, down sharply from 53.4 the prior day and from 76 in mid-October. It has dropped below 50 for the first time since the October pullback began, and momentum is falling with no oversold reading yet. [Bearish]
- 20 EMA: No 20 EMA value was supplied, so the EMA 50 at $185.26 stands in. Price ($184.11) closed below the EMA 50 for the first time in the 15-bar window, and below the SMA 50 ($186.90). Both are now overhead resistance. [Bearish]
- MACD: Line 2.03 against signal 3.91, a bearish crossover that happened around Oct 16. The histogram is negative and widening (about -1.88 versus -1.08 the prior day), and the line has fallen steadily from 8.39. [Bearish]
- Bollinger Bands (20): Upper $210.58, lower $183.91. Price closed right on the lower band after a 6.3% one-day drop, which is a stretched, near-term oversold condition. The bands are wide, so volatility is high. A band walk lower would confirm weakness, while a snap-back would signal only a reflex bounce. [Neutral]
- CMF (20): 0.085, still above +0.05 and rising slightly over the last three bars. The recent selloff has not yet shown up as distribution, though CMF is lagging and has fallen from 0.24. [Accumulation]
- ADX (14): 20.4 with −DI (26.5) above +DI (17.3). ADX has fallen from 37 to about 20, so the October uptrend is exhausted. The DI crossover (−DI above +DI since Oct 16, briefly reversed) shows sellers taking control, but trend strength is still marginal. [Weak Trend, bearish lean]
- Volume: 27.07M. This is a high reading relative to the quiet, declining volume of the last few weeks, and it came on a large red candle. That points to real selling pressure and a rejection from the $196–$209 zone. [Bearish – heavier volume on the down day]
DIVERGENCES & TRENDS
- Price made a high near $209 on Oct 12–13 and has since made lower highs ($201.72, $198.84, $196.42). The latest drop breaks the higher-low structure that has held since the August breakout.
- RSI has fallen from 76 to 42 and MACD has rolled over from 8.4 to 2.0. This shows momentum decay, not a classical divergence, because the price high and the indicator highs coincided.
- Crossovers:
- The EMA 50/200 and SMA 50/200 golden crosses are long-established. The 50-day SMA is $186.90 against the 200-day at $153.57, so the long-term uptrend is intact.
- The SMA 50 (rising to $186.90) and EMA 50 ($185.26) sit just overhead, and price has just lost both.
- The MACD bearish crossover and the −DI over +DI both remain active.
- Price is well above VWAP ($155.64) and the 200-day averages (EMA 200 $161.30, SMA 200 $153.57). That large gap makes a mean-reversion pullback toward $160–$170 plausible if the 50-day area fails.
- The slope of the long-term averages is up, which is why the bearish call has only modest conviction.
CHART PATTERNS
- Bearish Double Top (approximate): The two peaks around $209 (Oct 12–13) are followed by a lower-high sequence. The reference diagram's neckline equivalent is the $184–$186 zone (EMA 50, SMA 50, lower Bollinger Band), which price has just closed beneath. The measured move from a ~$25 pattern height (peak $209 to neckline $184) projects to roughly $159, near the EMA 200 and the August gap zone. This is a confirmation-dependent target.
- Bearish Pennant/Flag (loose): The tightening, lower-high consolidation in late October after the spike resembles a bearish flag. It is not clean and needs a further break to confirm.
- The broader chart shows a rally from $104 to $209, and the current structure is a pullback or distribution phase within it. Failure to reclaim $187 would favor the reversal pattern over a continuation.
POTENTIAL SCENARIOS
- Scenario 1: Bearish Breakdown and Retest of the 200-Day Zone — Price fails to reclaim the 50-day averages, the double-top neckline breaks, and the stock grinds toward the rising 200 EMA. Trigger: sustained closes below $183.90 (lower BB) with −DI staying above +DI. Target: $160–$172. Invalidation: daily close above $196.50 and MACD bullish crossover. (50% probability)
- Scenario 2: Bullish Reclaim and Recovery — The drop proves to be a shakeout within the long-term uptrend. CMF accumulation holds, price reclaims $187 and rebuilds toward the October highs. Trigger: close above $187 with RSI back above 50. Target: $200–$210. Invalidation: close below $172. (30% probability)
- Scenario 3: Neutral Range Consolidation — Price chops between the 200-day zone and the 50-day averages while ADX stays near 20. Trigger: no decisive break of $172 or $196. Target: $175–$192. Invalidation: close outside the $165–$200 band. (20% probability)
PRICE TARGETS
- Target Price: $172.00 (97-day horizon, Feb 6, 2027)
- Expected Range: $152.00 to $196.00 (width $44, about 23.9% of the current price, consistent with the 61–180 day guidance)
- Key Levels: Support at $161.30 (EMA 200), Resistance at $196.40 (late-October shelf, with the $186.90 SMA 50 as nearer overhead resistance)
OVERALL BIAS
OVERALL BIAS: BEARISH - Price broke below the EMA 50 and SMA 50 on heavy volume, with a bearish MACD crossover, falling RSI and −DI above +DI, plus a double-top-like structure near $209. The long-term trend (price far above the 200-day averages) and positive CMF cap conviction, so the target is a pullback toward the $160s–$170s zone, not a trend reversal.
This is educational analysis and not financial advice.