RKLB 97-day bearish forecast — Nov 1, 2026
- Bias: Bearish
- Timeframe: 97 days (made Nov 1, 2026, target date Feb 5, 2027)
- Price at analysis: $54.73
- Price target: $50.50
- Expected range: $43.00 – $58.00
- Result: Pending — graded after the close on Feb 5, 2027
Get a free AI analysis of RKLB today
Analysis
TECHNICAL INDICATORS
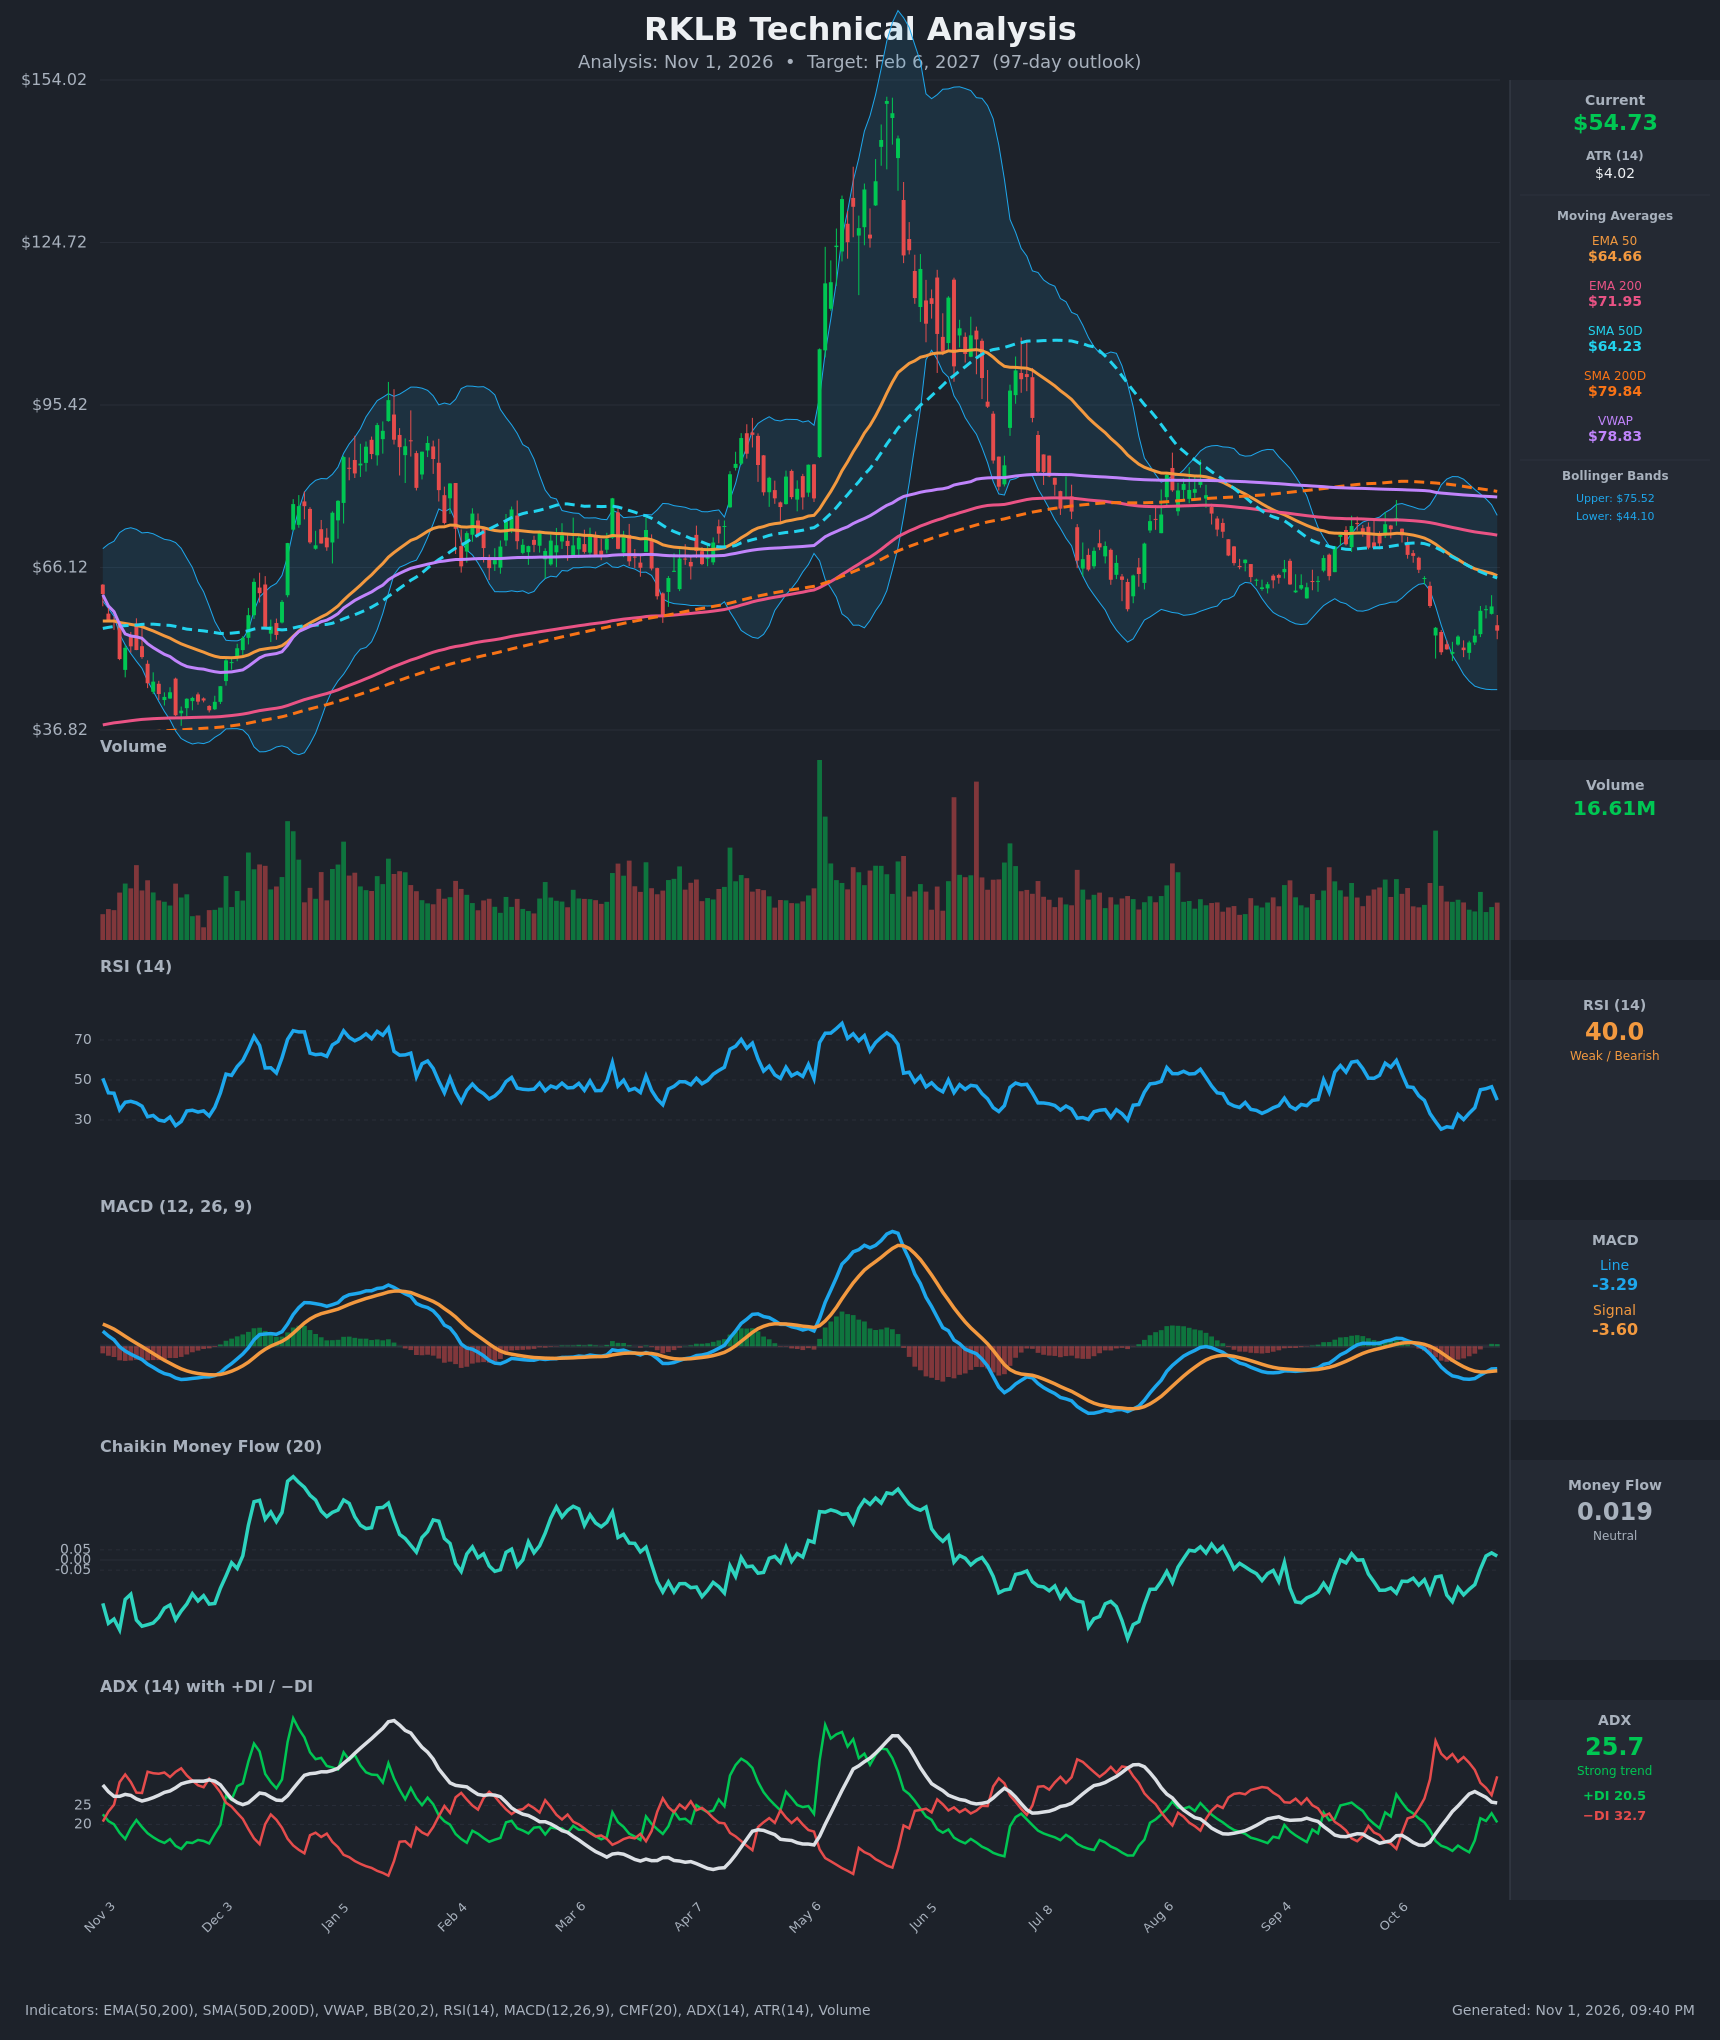
- RSI (14): 39.96, down from 46.6 on Oct 29 after the 7.4% drop on Oct 30. It bottomed near 25 on Oct 16 (oversold) and the bounce stalled below 50, which is typical of a bear-market rally. Momentum is weak but not oversold. [Bearish]
- 20 EMA: Not supplied. The EMA 50 at $64.66 is about 18% above price, and every moving average is overhead and falling. The 50 EMA has fallen from $71.72 to $64.66 in 15 bars, so rallies toward it face supply. [Bearish]
- MACD: Line -3.288 vs signal -3.598, a histogram of about +0.31. The line crossed above the signal on Oct 28, but both remain deeply negative below zero. This is a weak, low-quality bullish crossover inside a downtrend, and it is fading as price drops again. [Neutral]
- Bollinger Bands (20): Upper $75.52, lower $44.10, mid-band about $59.8. Price at $54.73 sits in the lower half, below the mid-band, after failing near it at $59. The wide bands show elevated volatility, and the lower band is the downside reference. [Bearish]
- CMF (20): 0.019, which is neutral (between -0.05 and +0.05). It improved from -0.20 on Oct 20 and briefly turned positive, but there is no real accumulation. Selling pressure has eased without buyers taking control. [Neutral]
- ADX (14): 25.7 with +DI 20.5 and −DI 32.7. ADX is above 25, so the trend is strong, and −DI is clearly on top. ADX has been easing from 28.7, which suggests selling momentum is peaking. [Strong Trend – Bearish]
- Volume: 16.61M on the latest down bar, after rising volume on the Oct 27 bounce. There is no climactic capitulation volume. The sell-off in mid-October came on moderate to heavy volume with no confirmed reversal. [Neutral to Bearish]
DIVERGENCES & TRENDS
- Death cross in force: SMA50D ($64.23) is below SMA200D ($79.84), and EMA50 ($64.66) is below EMA200 ($71.95). Price is below SMA200D, which means a long-term downtrend.
- VWAP: Price is far below VWAP ($78.83), so sellers hold the longer-term cost basis. Bounces toward $65-79 would meet heavy overhead supply.
- Lower highs and lower lows: Price fell from a peak above $150 in May-June to about $50. Each rally since June has failed at progressively lower levels.
- Mild bullish divergence: RSI made a low near 25 on Oct 16 and 26-27 around Oct 20, and the Oct 29 low held. MACD's histogram turned up while price retested the $51-53 area. This supports a short-term bounce but not a trend reversal.
- DI trend: −DI has stayed above +DI since mid-October. +DI has not recovered past 23, so there is no bullish DI crossover.
- MACD: The tiny bullish crossover is below zero, which is a weak signal. A roll-over of the histogram is likely after the Oct 30 drop.
- Rejection: The Oct 27-29 rally stalled around $58-59 and reversed sharply to $54.73.
CHART PATTERNS
- Bearish continuation (primary): Since the June peak the chart resembles a large Head and Shoulders / lower-high decline. The Aug-Sep consolidation resembled a Bearish Flag/Pennant near $62-72, and its break lower in October confirmed the downside continuation. The measured move from that consolidation points to the $44-50 area.
- Potential Bullish Double Bottom (secondary): Lows near $50.84 (Oct 16) and $50.90 (Oct 20), with a neckline around $58-59. A close above $59 would activate the pattern, with a measured target near $67-68. Price has not broken the neckline, and the Oct 30 rejection weakens the setup.
- Downside target: Failure of the $50-51 double-bottom support would open a move toward the lower Bollinger Band at $44 and then roughly $40-41.
POTENTIAL SCENARIOS
- Scenario 1: Bearish Trend Continuation — The downtrend resumes with −DI dominant, all MAs overhead and price below the death-crossed averages. Bounces fail at the $59 neckline and the $64 SMA50D/EMA50 zone. Trigger: a daily close below $50.80. Target: $44-48, with a possible extension to $41. Invalidation: a daily close above $59.50 with expanding volume. (45% probability)
- Scenario 2: Bullish Double-Bottom Reversal — Price holds the $50-51 base, an oversold bounce builds, and RSI reclaims 50 as CMF turns positive. Trigger: a close above $59.10 with volume. Target: $64-68 (EMA50/SMA50D, then the pattern target). Invalidation: a close below $50. (33% probability)
- Scenario 3: Neutral Range Consolidation — Price chops between $50 and $59 as ADX fades from 25.7. Trigger: failed breaks on both sides. Target: $52-57. Invalidation: a close outside the $49.50-$60 range. (22% probability)
PRICE TARGETS
- Target Price: $50.50 (97-day horizon, a modest downside drift given the bearish structure and the possible support bounce)
- Expected Range: $43.00 to $58.00 (width $15.00, about 27.4% of the current price, consistent with the 61-180 day guidance)
- Key Levels: Support at $50.80, Resistance at $59.10
OVERALL BIAS
OVERALL BIAS: BEARISH - Price is below every moving average, with a death cross, −DI (32.7) well above +DI (20.5), ADX above 25, and a failed bounce at $58-59. The weak MACD crossover and neutral CMF support only a limited relief bounce, with the $50-51 double-bottom as the key level.
This is educational analysis and not financial advice.