QBTS 97-day bearish forecast — Nov 1, 2026
- Bias: Bearish
- Timeframe: 97 days (made Nov 1, 2026, target date Feb 5, 2027)
- Price at analysis: $10.65
- Price target: $9.60
- Expected range: $8.40 – $11.20
- Result: Pending — graded after the close on Feb 5, 2027
Get a free AI analysis of QBTS today
Analysis
TECHNICAL INDICATORS
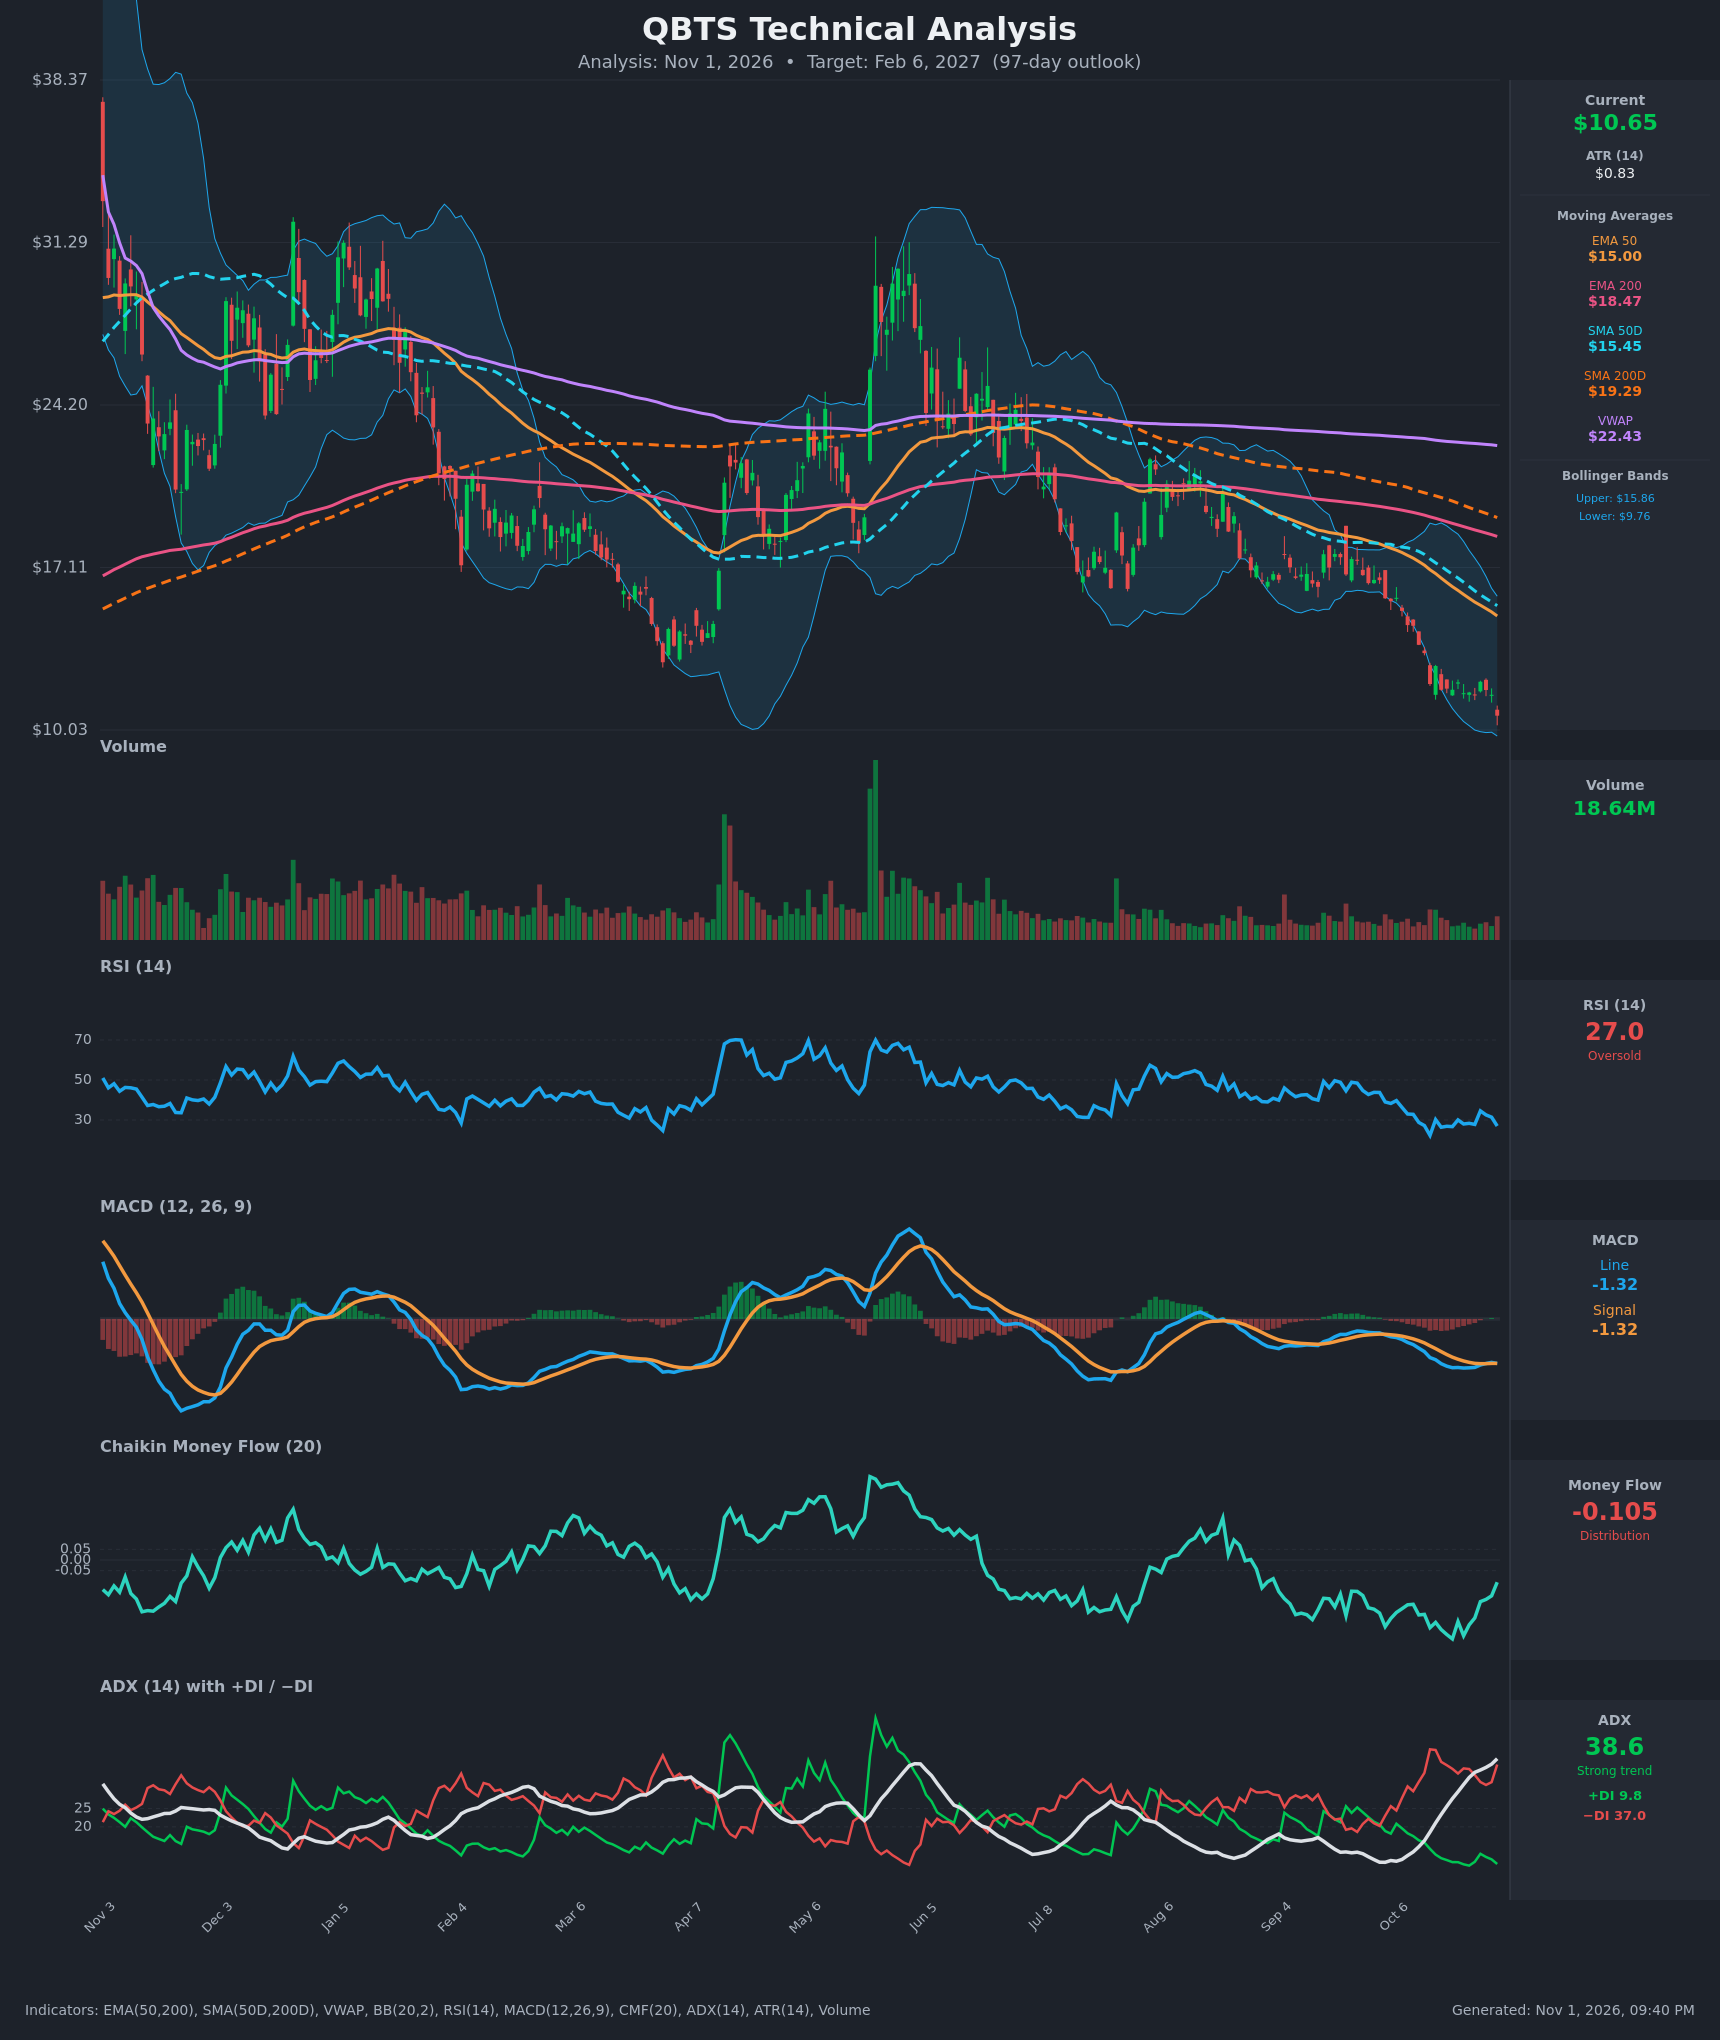
- RSI (14): 26.98, in oversold territory (<30). It has stayed in the 22-35 range for about three weeks, with the Oct 14 low at 22.3 and a failed bounce to 34.6 on Oct 27. There is no bullish momentum turn yet, and it is rolling over again after Oct 30's -8% day. [Bearish]
- 20 EMA: The 20 EMA was not supplied, so I use the EMA 50 as the nearest dynamic reference. EMA 50 is $15.00 and EMA 200 is $18.47. Price is about 29% below the EMA 50 and 42% below the EMA 200. Both are falling and act as heavy overhead resistance. [Bearish]
- MACD: The line is -1.3216 and the signal is -1.3198, so the histogram is about zero. The line crossed back below the signal on Oct 30 after a brief move above on Oct 28-29. Both lines are deeply negative and flat, so momentum is not accelerating down but gives no bullish crossover either. [Bearish]
- Bollinger Bands (20): Upper is $15.86 and lower is $9.76, with the midline near $12.81. Price at $10.65 is in the bottom 10% of the band, and the bands are sloping down and widening. The chart shows price riding the lower band through October, which is a "band walk" in a downtrend. A mean-reversion bounce is possible, but the band structure favors continuation. [Bearish]
- CMF (20): -0.105 is below the -0.05 threshold, so it signals distribution. It improved from -0.37 (Oct 20) but remains negative, and the recent uptick is not accumulation. [Distribution]
- ADX (14): 38.6 and rising for 15 straight bars (from 14.5), which marks a strong trend. −DI is 37.0 against +DI at 9.8, so sellers are in firm control. [Strong Trend - Bearish]
- Volume: 18.64M, light compared with the spikes during the April and May rallies, and fading through the decline. Without a capitulation spike, this looks like steady, orderly selling rather than a washout. [Neutral-to-Bearish: no capitulation volume yet]
DIVERGENCES & TRENDS
- Moving-average structure: SMA50D ($15.45) is below SMA200D ($19.29) and EMA50 ($15.00) is below EMA200 ($18.47). This is a confirmed death cross and a long-term downtrend. Price is below every MA, and VWAP at $22.43 is more than 2x the price.
- No bullish divergence: RSI made a lower low on Oct 14 (22.3) and is now at 27 with price at a new low. RSI has not made a higher low, so there is no bullish divergence to support a reversal. The MACD line is roughly flat while price makes lower lows, which is only a mild sign of decelerating downside momentum.
- Trend persistence: ADX is rising with −DI dominant and +DI at multi-month lows (9.8). The chart shows ADX climbing to the highest level of the past year, which usually means the move has force behind it.
- Breakdown: Price consolidated at $11.54-$12.13 for about two weeks and broke down on Oct 30 to $10.65. This is a bearish continuation break.
- Oversold caveat: RSI below 30 combined with the lower Bollinger Band does raise the odds of a relief bounce. Those bounces in strong trends usually stall below the 50 EMA (~$15) or at the former support near $11.5-$12.
CHART PATTERNS
- Bearish Flag / Pennant (continuation): The tight $11.54-$12.13 range after the early-October drop from about $17 to $12 matches the Bearish Flag/Pennant. The break below the range on Oct 30 completes the pattern, and the measured move from the pole points well below, toward roughly $7-8.
- Descending channel / lower highs: Since the June peak (~$31), price has made a series of lower highs and lower lows. This fits a broader bearish structure similar to the Descending Triangle breakdown, with no sign of a Bullish Falling Wedge or double-bottom reversal.
- Caveat: The measured-move target is optimistic for 97 days, so I use a more conservative target of about $9.60, just below the lower Bollinger Band and the chart low near $10.
POTENTIAL SCENARIOS
- Scenario 1: Bearish Trend Continuation — Price breaks the lower band and the $10.03 chart low, then grinds lower with the strong ADX trend and distribution. Rallies stall below $12. Trigger: daily close below $9.76 with −DI staying above 35. Target: $9.60 in the base case, with an extension toward $8.40. Invalidation: daily close above $12.13 with +DI crossing above −DI. (50% probability)
- Scenario 2: Bullish Oversold Relief Rally — Price is oversold (RSI under 30, at the lower band), and a bounce toward the mean develops. Trigger: RSI climbs back above 35 with a bullish MACD crossover and volume expansion. Target: $12.80-$13.50 (the Bollinger midline and the prior breakdown zone). Invalidation: close below $9.76. (35% probability)
- Scenario 3: Neutral Basing Range — Price stabilizes between $9.50 and $11.50 as selling exhausts and ADX rolls over. Trigger: low-volume chop with RSI holding 30-40. Target: $10.50-$11.00. Invalidation: close outside the $9.50-$11.50 range. (15% probability)
PRICE TARGETS
- Target Price: $9.60 (97-day horizon, Feb 6, 2027)
- Expected Range: $8.40 to $11.20 (width $2.80, about 26% of the current price, consistent with the 18-30% guidance for 61-180 days)
- Key Levels: Support at $9.76 (lower Bollinger Band, just under the $10.03 chart low), Resistance at $12.13 (top of the broken consolidation range)
OVERALL BIAS
OVERALL BIAS: BEARISH - Price is below every major moving average after a death cross, ADX is 38.6 and rising with −DI (37.0) far above +DI (9.8), CMF shows distribution, and the bear-flag breakdown below $11.50 confirms continuation. The oversold RSI (27) raises the risk of sharp bounces, but there is no bullish divergence yet and rallies are likely to meet resistance near $12.
This is educational analysis and not financial advice.