SOFI 97-day bullish forecast — Nov 1, 2026
- Bias: Bullish
- Timeframe: 97 days (made Nov 1, 2026, target date Feb 5, 2027)
- Price at analysis: $16.76
- Price target: $18.10
- Expected range: $14.80 – $19.60
- Result: Pending — graded after the close on Feb 5, 2027
Get a free AI analysis of SOFI today
Analysis
TECHNICAL INDICATORS
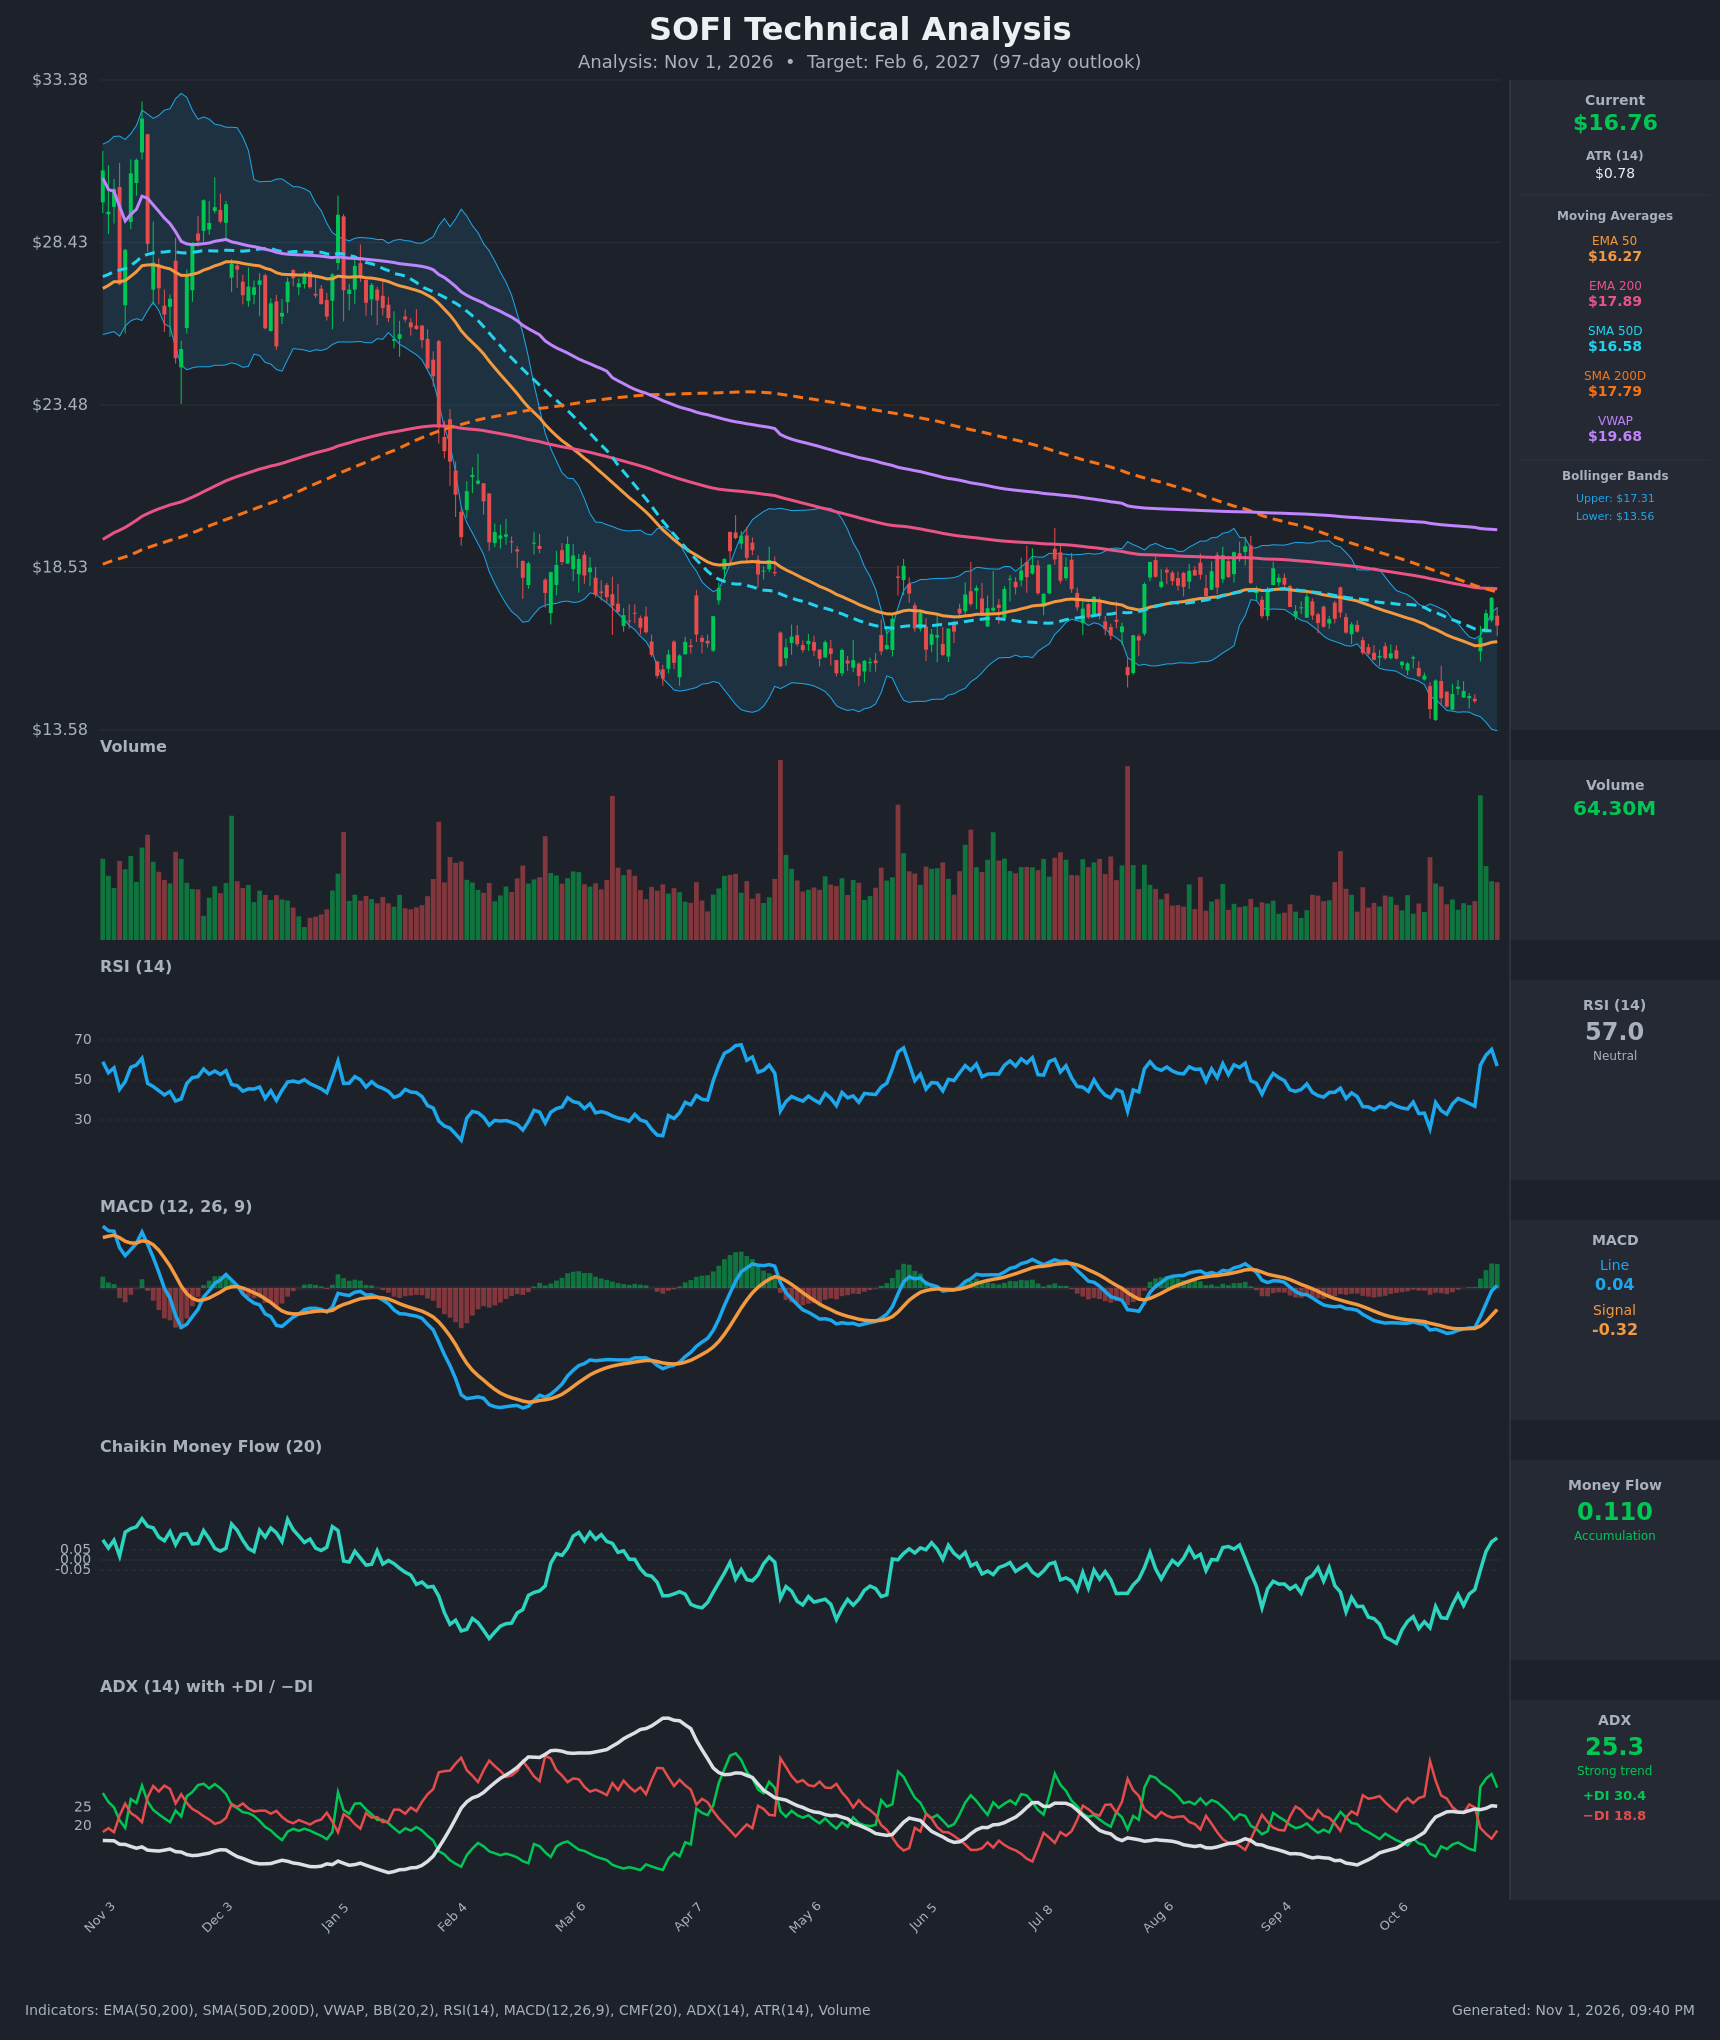
- RSI (14): 56.97, up from 33-40 in mid-October and a peak of 65.2 on Oct 29. It has turned from the bottom of the range to above the 50 midline, then dipped slightly on the Oct 30 pullback. Not overbought. [Bullish]
- 20 EMA: The 20 EMA wasn't supplied, so I use the EMA 50 at $16.27 as the nearest dynamic reference. Price ($16.76) is above it, and the SMA 50D at $16.58 is also just below price, so both act as support. The EMA 200 ($17.89) and SMA 200D ($17.79) sit overhead as resistance. [Bullish]
- MACD: Line 0.038 crossed above the signal at -0.322 on Oct 30, and the histogram has flipped positive and is expanding. The line has just reached the zero line, so a hold above zero would confirm the shift. [Bullish]
- Bollinger Bands (20): Upper $17.31, lower $13.56, and the bands are wide. Price tagged the lower band area in late October, then bounced hard through the midline (about $15.44) toward the upper band. The $17.31 upper band is the first test. [Bullish]
- CMF (20): 0.110, up from about -0.29 in mid-October and above +0.05 since Oct 28. It shows a clear swing from distribution to accumulation, supported by the high-volume green breakout bar. [Accumulation]
- ADX (14): 25.3 with +DI at 30.4 above −DI at 18.8. The +DI/−DI crossover on Oct 27 gave bulls control, and ADX is just above 25. The trend is strengthening, though it is only newly established. [Strong Trend, Bullish]
- Volume: 64.30M, with a large volume spike on the Oct 27 breakout bar, one of the biggest in recent months and well above average. Heavy volume on the up-move suggests real buying. The Oct 30 pullback came on lower volume. [Bullish]
DIVERGENCES & TRENDS
- Bullish divergence: Price made lower lows into Oct 14-26 ($14.22, $14.46), while RSI (about 37) and MACD (-0.60) were holding higher than at the spring and summer lows. CMF also bottomed in October, and this momentum improvement preceded the Oct 27 breakout.
- Crossovers: The MACD bullish crossover (Oct 30) and the +DI/−DI flip (Oct 27) are both recent. Price reclaimed the EMA 50 and SMA 50D on Oct 27.
- Long-term trend still bearish: The SMA 50D is below the SMA 200D (death cross in effect), and the EMA 50 is below the EMA 200. Price is also below the EMA 200, SMA 200D and VWAP ($19.68). The ~50% decline from $33 is still the dominant structure.
- Convergence overhead: The EMA 200 and SMA 200D ($17.8-17.9) are falling and converging with price. The SMA 50D at $16.58 is rising toward the SMA 200D, so a golden cross is possible later in the window if price holds.
CHART PATTERNS
- Bullish Falling Wedge / falling channel breakout: The Aug-Oct decline from about $19.5 to $14.2 formed a descending channel, and price broke out on Oct 27 with heavy volume. The reference diagram shows this as a reversal pattern, with a measured target at the start of the channel, near $18.5-19.5.
- Base / Bullish Double Bottom-style structure: Lows near $14.2-15.5 have held since April (the $15.2-15.5 area in April and the $14.2 low in October). That supports a multi-month base within a $14.5-19.5 range.
- Caveat: The $17.8-18.5 zone is a heavy resistance cluster. The EMA 200 and SMA 200D sit there, along with the June-August congestion. A failure there would turn this into a lower-high range-bound pattern, as in the Bearish Rising Wedge/Descending Triangle area of the reference.
POTENTIAL SCENARIOS
- Scenario 1: Bullish Breakout Above the 200-Day Cluster — The accumulation and the MACD/DI shift carry price through the EMA 200 and SMA 200D, and a possible golden cross reinforces it. Trigger: daily close above $17.90 on rising volume, then above $18.50. Target: $18.50-$19.50, with VWAP ($19.68) as a stretch target. Invalidation: a close below $15.50 (the pullback low area, below the EMA 50/SMA 50D). (50% probability)
- Scenario 2: Bearish Rejection and Retest of Lows — Price fails at the $17.3-17.9 resistance, the breakout proves to be a bear-market rally, and price rolls over toward the lows. Trigger: rejection at $17.3-17.9 followed by a close below $16.27, then below $15.50. Target: $14.50-$15.00, a retest of the October lows. Invalidation: a sustained close above $18.00. (28% probability)
- Scenario 3: Neutral Range Chop — Price oscillates between the 50-day averages and the 200-day averages. Trigger: repeated failures at $17.9 and repeated holds at $16.0. Target: $16.00-$17.80. Invalidation: a close above $18.50 or below $15.00. (22% probability)
PRICE TARGETS
- Target Price: $18.10 (97 days, about +8% from $16.76)
- Expected Range: $14.80 to $19.60 (width $4.80, about 28.6% of price, consistent with the 61-180 day guidance of 18-30%)
- Key Levels: Support at $16.27 (EMA 50, with the SMA 50D just above at $16.58), Resistance at $17.89 (EMA 200, with the SMA 200D at $17.79)
OVERALL BIAS
OVERALL BIAS: BULLISH - Momentum, money flow and trend direction have all flipped positive: the MACD crossed, the +DI is above the −DI, the CMF is in accumulation, and a high-volume breakout came off the October lows. The main risk is the heavy overhead resistance at $17.8-17.9 and the still-bearish long-term structure, so conviction is moderate.
This is educational analysis and not financial advice.