SMH 97-day bearish forecast — Nov 1, 2026
- Bias: Bearish
- Timeframe: 97 days (made Nov 1, 2026, target date Feb 5, 2027)
- Price at analysis: $522.49
- Price target: $505.00
- Expected range: $450.00 – $575.00
- Result: Pending — graded after the close on Feb 5, 2027
Get a free AI analysis of SMH today
Analysis
TECHNICAL INDICATORS
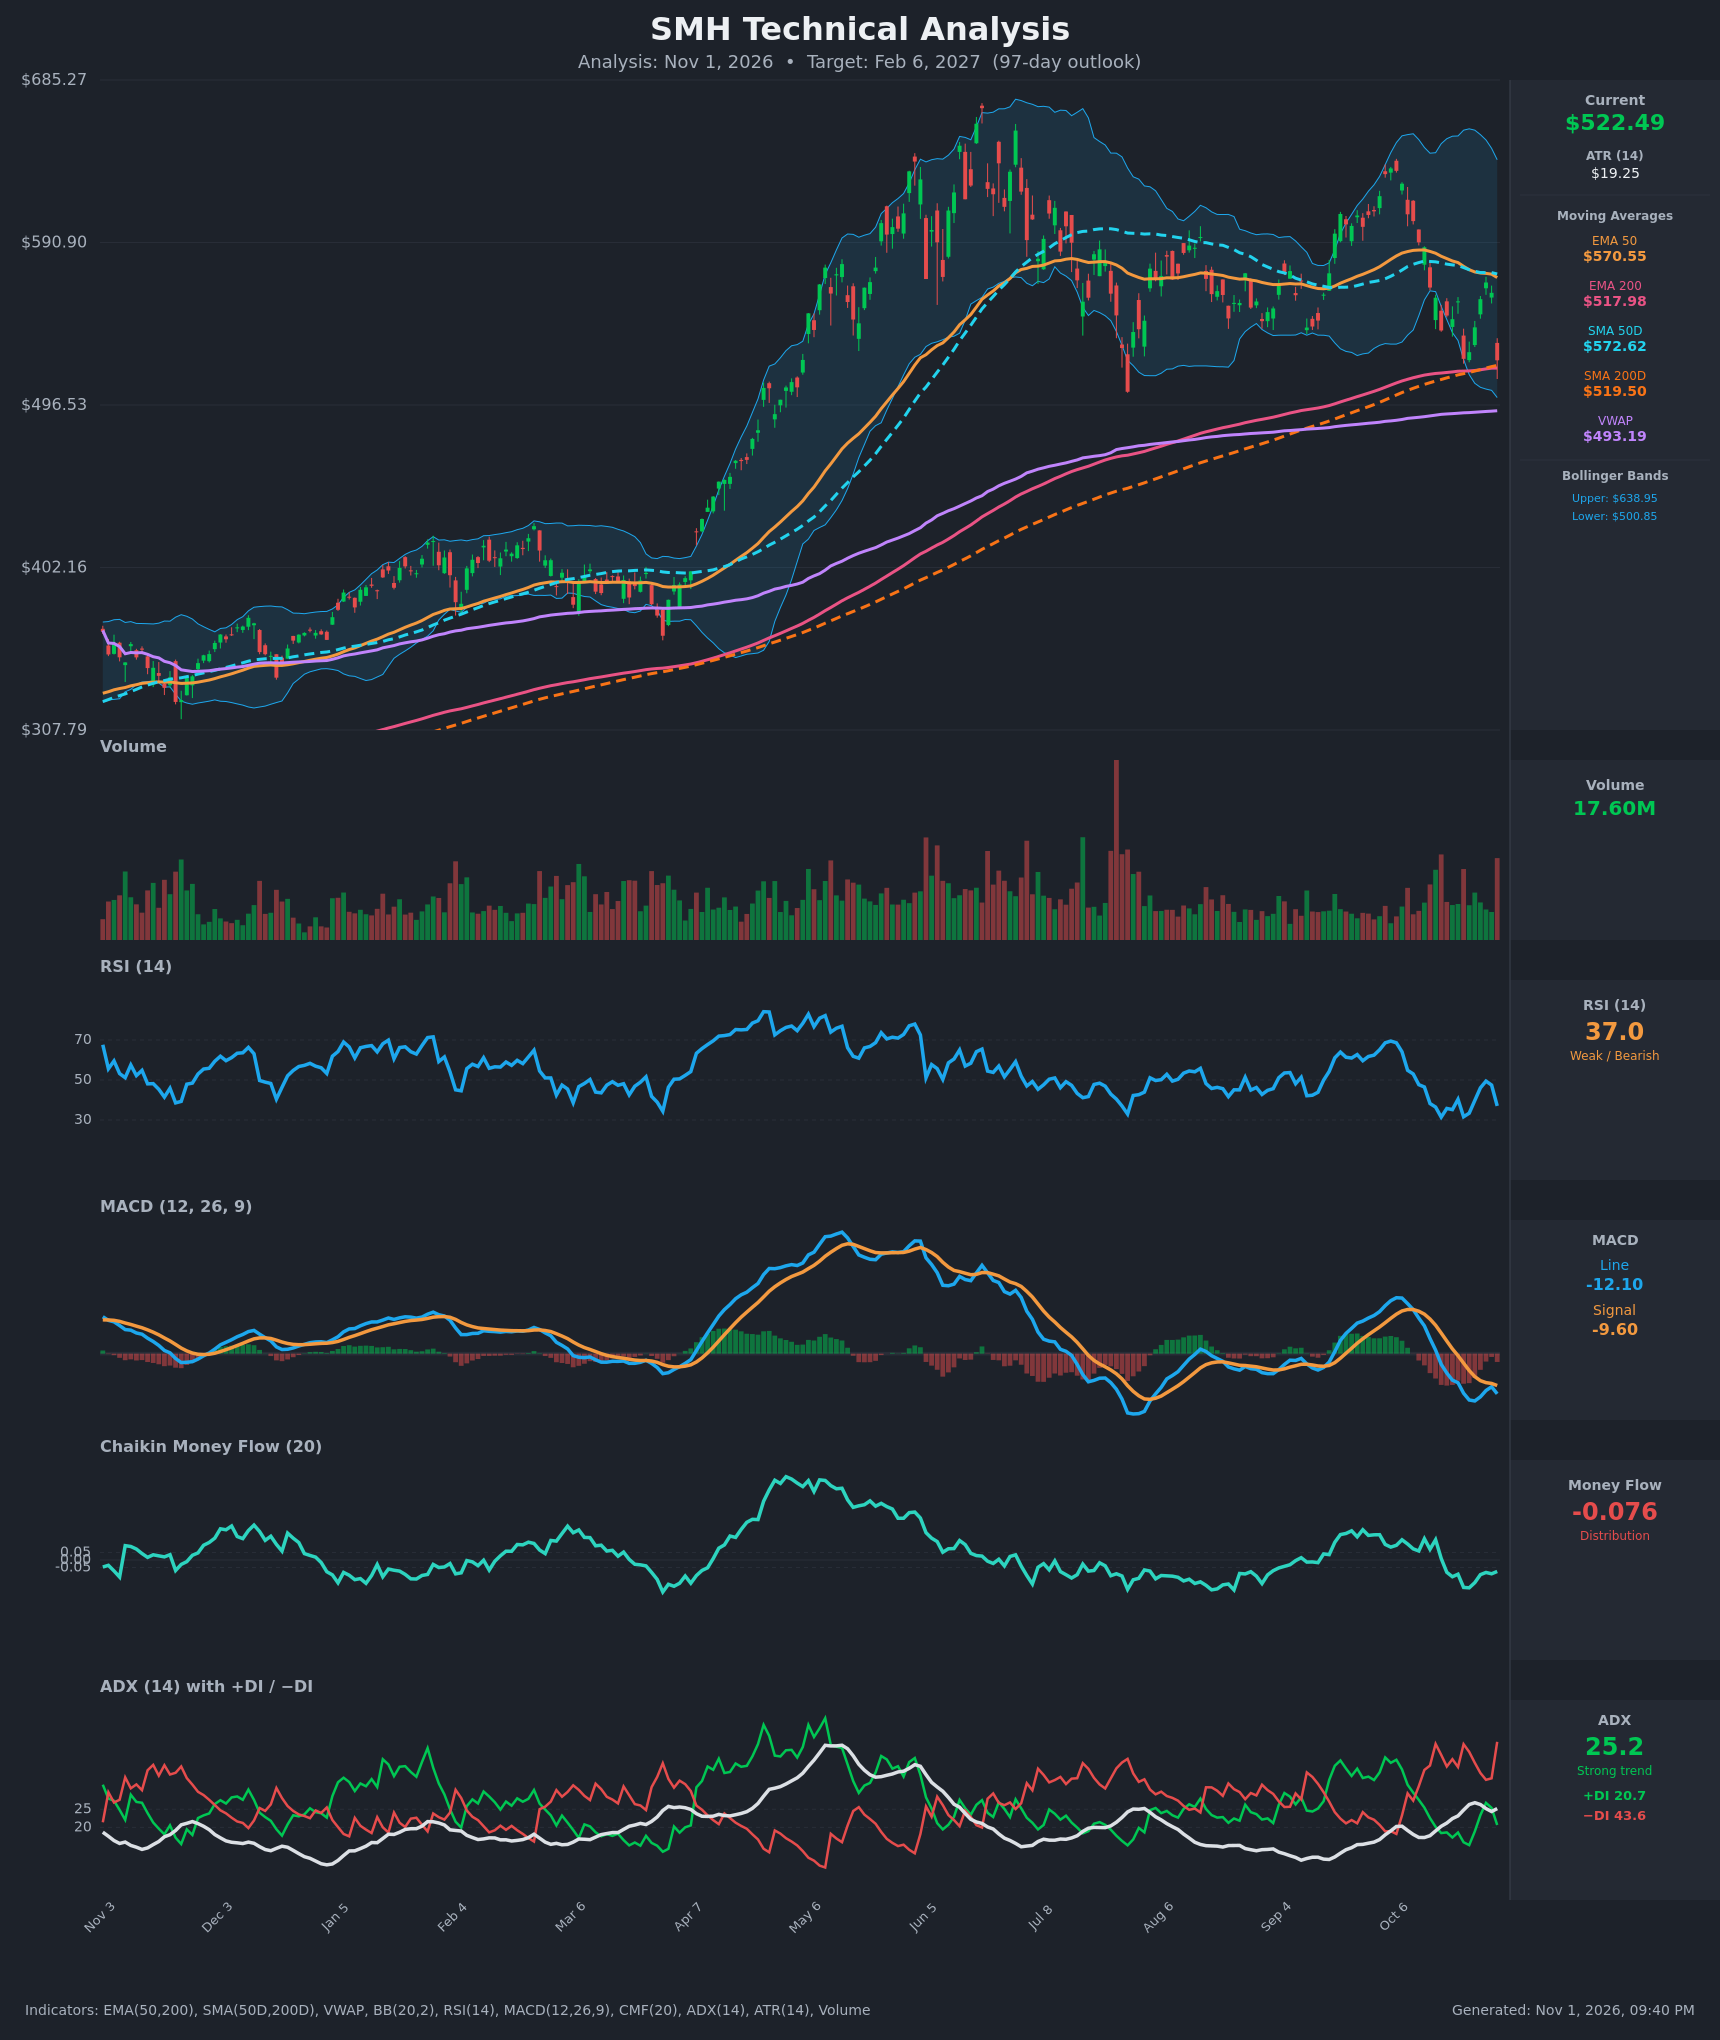
- RSI (14): 37.04, down from 49.4 on Oct 28. It is weak but not yet oversold (<30). It bounced from about 31 twice (Oct 16 and Oct 22) and made a lower high on this latest bounce, which shows momentum is fading. [Bearish]
- 20 EMA: Not supplied. Using the EMA 50 ($570.55) as the nearest trend proxy, price is about 8.4% below it, so it acts as overhead resistance. The EMA 50 is sloping down and falling toward the EMA 200 ($517.98). [Bearish]
- MACD: Line -12.10 is below Signal -9.60, with a negative and widening histogram. A bearish crossover occurred around Oct 21, and the line is turning down again after a brief bounce. It is well below zero. [Bearish]
- Bollinger Bands (20): Price at $522.49 is near the lower band ($500.85) and far below the upper band ($638.95). The bands are wide, so volatility is elevated. The gap to the lower band is small, so a downside band-walk is possible, though a mean-reversion bounce toward the midline (~$570) is also plausible. [Neutral]
- CMF (20): -0.076, below the -0.05 threshold and negative for most of the past three weeks. It has had no real recovery, so selling pressure and distribution persist. [Distribution]
- ADX (14): 25.2 with −DI at 43.6 far above +DI at 20.7. This is a strong, bear-controlled trend, and the −DI spike on the latest bar shows fresh selling. [Strong Trend – Bearish]
- Volume: 17.60M on the latest bar, a large red candle and one of the higher readings of the last few weeks. A heavy-volume drop of about 7% on one day is typical of distribution or a breakdown attempt. [Bearish – heavy selling volume]
Other moving averages:
- EMA 200 / SMA 200D: $517.98 and $519.50. Price is only about 0.6% above both, so this is the key battleground.
- SMA 50D: $572.62, which is resistance.
- VWAP: $493.19, the next major support below.
DIVERGENCES & TRENDS
- There is no clear bullish RSI or MACD divergence. RSI made a slightly higher low on Oct 22 and is now bouncing, but MACD and CMF both made lower lows, which confirms the weakness.
- The MACD bearish crossover on Oct 21 persists, and its histogram is expanding negative.
- The −DI/+DI gap has widened to more than 22 points while ADX has turned up through 25. That is trend-strength confirmation for the downside.
- The SMA 50D ($572.62) is converging on the SMA 200D ($519.50), and the EMA 50 is converging on the EMA 200. A death cross is possible within the 97-day window if weakness continues. No cross has occurred yet, and the long-term trend is still technically up while price holds above the 200s.
- Price has lost the 50-day averages. Rallies have repeatedly failed at them (Oct 28 bounce to $567.67, then a drop to $522.49).
- The prior peak was about $680 in June. Since then price has made lower highs (about $610 in October) and is now retesting the August low (about $510–520).
CHART PATTERNS
- Descending Triangle (bearish continuation) / developing lower-high structure: Lower highs from the ~$680 peak to ~$610 sit against a flat support zone near $510–$520, which is also the 200-day SMA/EMA confluence. A decisive close below about $510 would confirm the breakdown.
- The pattern height is roughly $100–$110, which projects to about $410–$420 as a measured move. That is a stretch for 97 days, so I take a partial move toward about $450–$495.
- Possible Bearish Head and Shoulders / Double Top flavor: The June peak with a lower October high is not a clean double top, so I treat this only as a warning.
- Bullish counter-case: If the $500–$520 zone holds, it becomes a broad range or triple-bottom-style base (~$500–$520 floor, ~$610 ceiling). That would give a mean-reversion target of about $570–$590.
POTENTIAL SCENARIOS
- Scenario 1: Bearish Breakdown Below the 200-Day Averages — Price fails to hold the $518–$520 200-day confluence. Selling continues as −DI dominates, CMF stays negative, and the 50s roll over toward a death cross. Trigger: daily close below ~$510 on above-average volume. Target: $493 (VWAP), then $450–$470. Invalidation: daily close back above $572 (SMA 50D / EMA 50). (45% probability)
- Scenario 2: Bullish Bounce Off 200-Day Support — The $500–$520 zone holds as the long-term uptrend support. RSI turns up from the high 30s, and price mean-reverts toward the 50-day averages. Trigger: a bullish MACD cross and a close above ~$557–$568. Target: $570–$590. Invalidation: close below $500. (38% probability)
- Scenario 3: Neutral Range-Bound Chop — Price oscillates between ~$495 and ~$570 for the whole window as the 200-day averages offer support and the 50s offer resistance. Trigger: ADX fading below 20 with price pinned mid-range. Target: $520–$545. Invalidation: a close outside the $495–$575 range. (17% probability)
PRICE TARGETS
Range check: $575 − $450 = $125, which is 23.9% of $522.49. That fits the 61–180 day guidance of 18–30%.
- Target Price: $505.00 (97 days, Feb 6, 2027)
- Expected Range: $450.00 to $575.00
- Key Levels: Support at $493.19 (VWAP, just below the lower Bollinger Band at $500.85), Resistance at $570.55 (EMA 50, with the SMA 50D at $572.62)
OVERALL BIAS
OVERALL BIAS: BEARISH - Price is below the 50-day averages with a bearish MACD cross, −DI at 43.6 versus +DI at 20.7, ADX above 25, and persistent CMF distribution. The heavy-volume drop leaves price sitting on the 200-day support confluence, and the lower-high structure from the June peak favors a downside break toward VWAP (~$493) and lower. Conviction is modest because RSI is near oversold and long-term support sits right under price.
This is educational analysis and not financial advice.