SOXS 97-day bearish forecast — Nov 1, 2026
- Bias: Bearish
- Timeframe: 97 days (made Nov 1, 2026, target date Feb 5, 2027)
- Price at analysis: $52.08
- Price target: $44.50
- Expected range: $38.00 – $54.00
- Result: Pending — graded after the close on Feb 5, 2027
Get a free AI analysis of SOXS today
Analysis
TECHNICAL INDICATORS
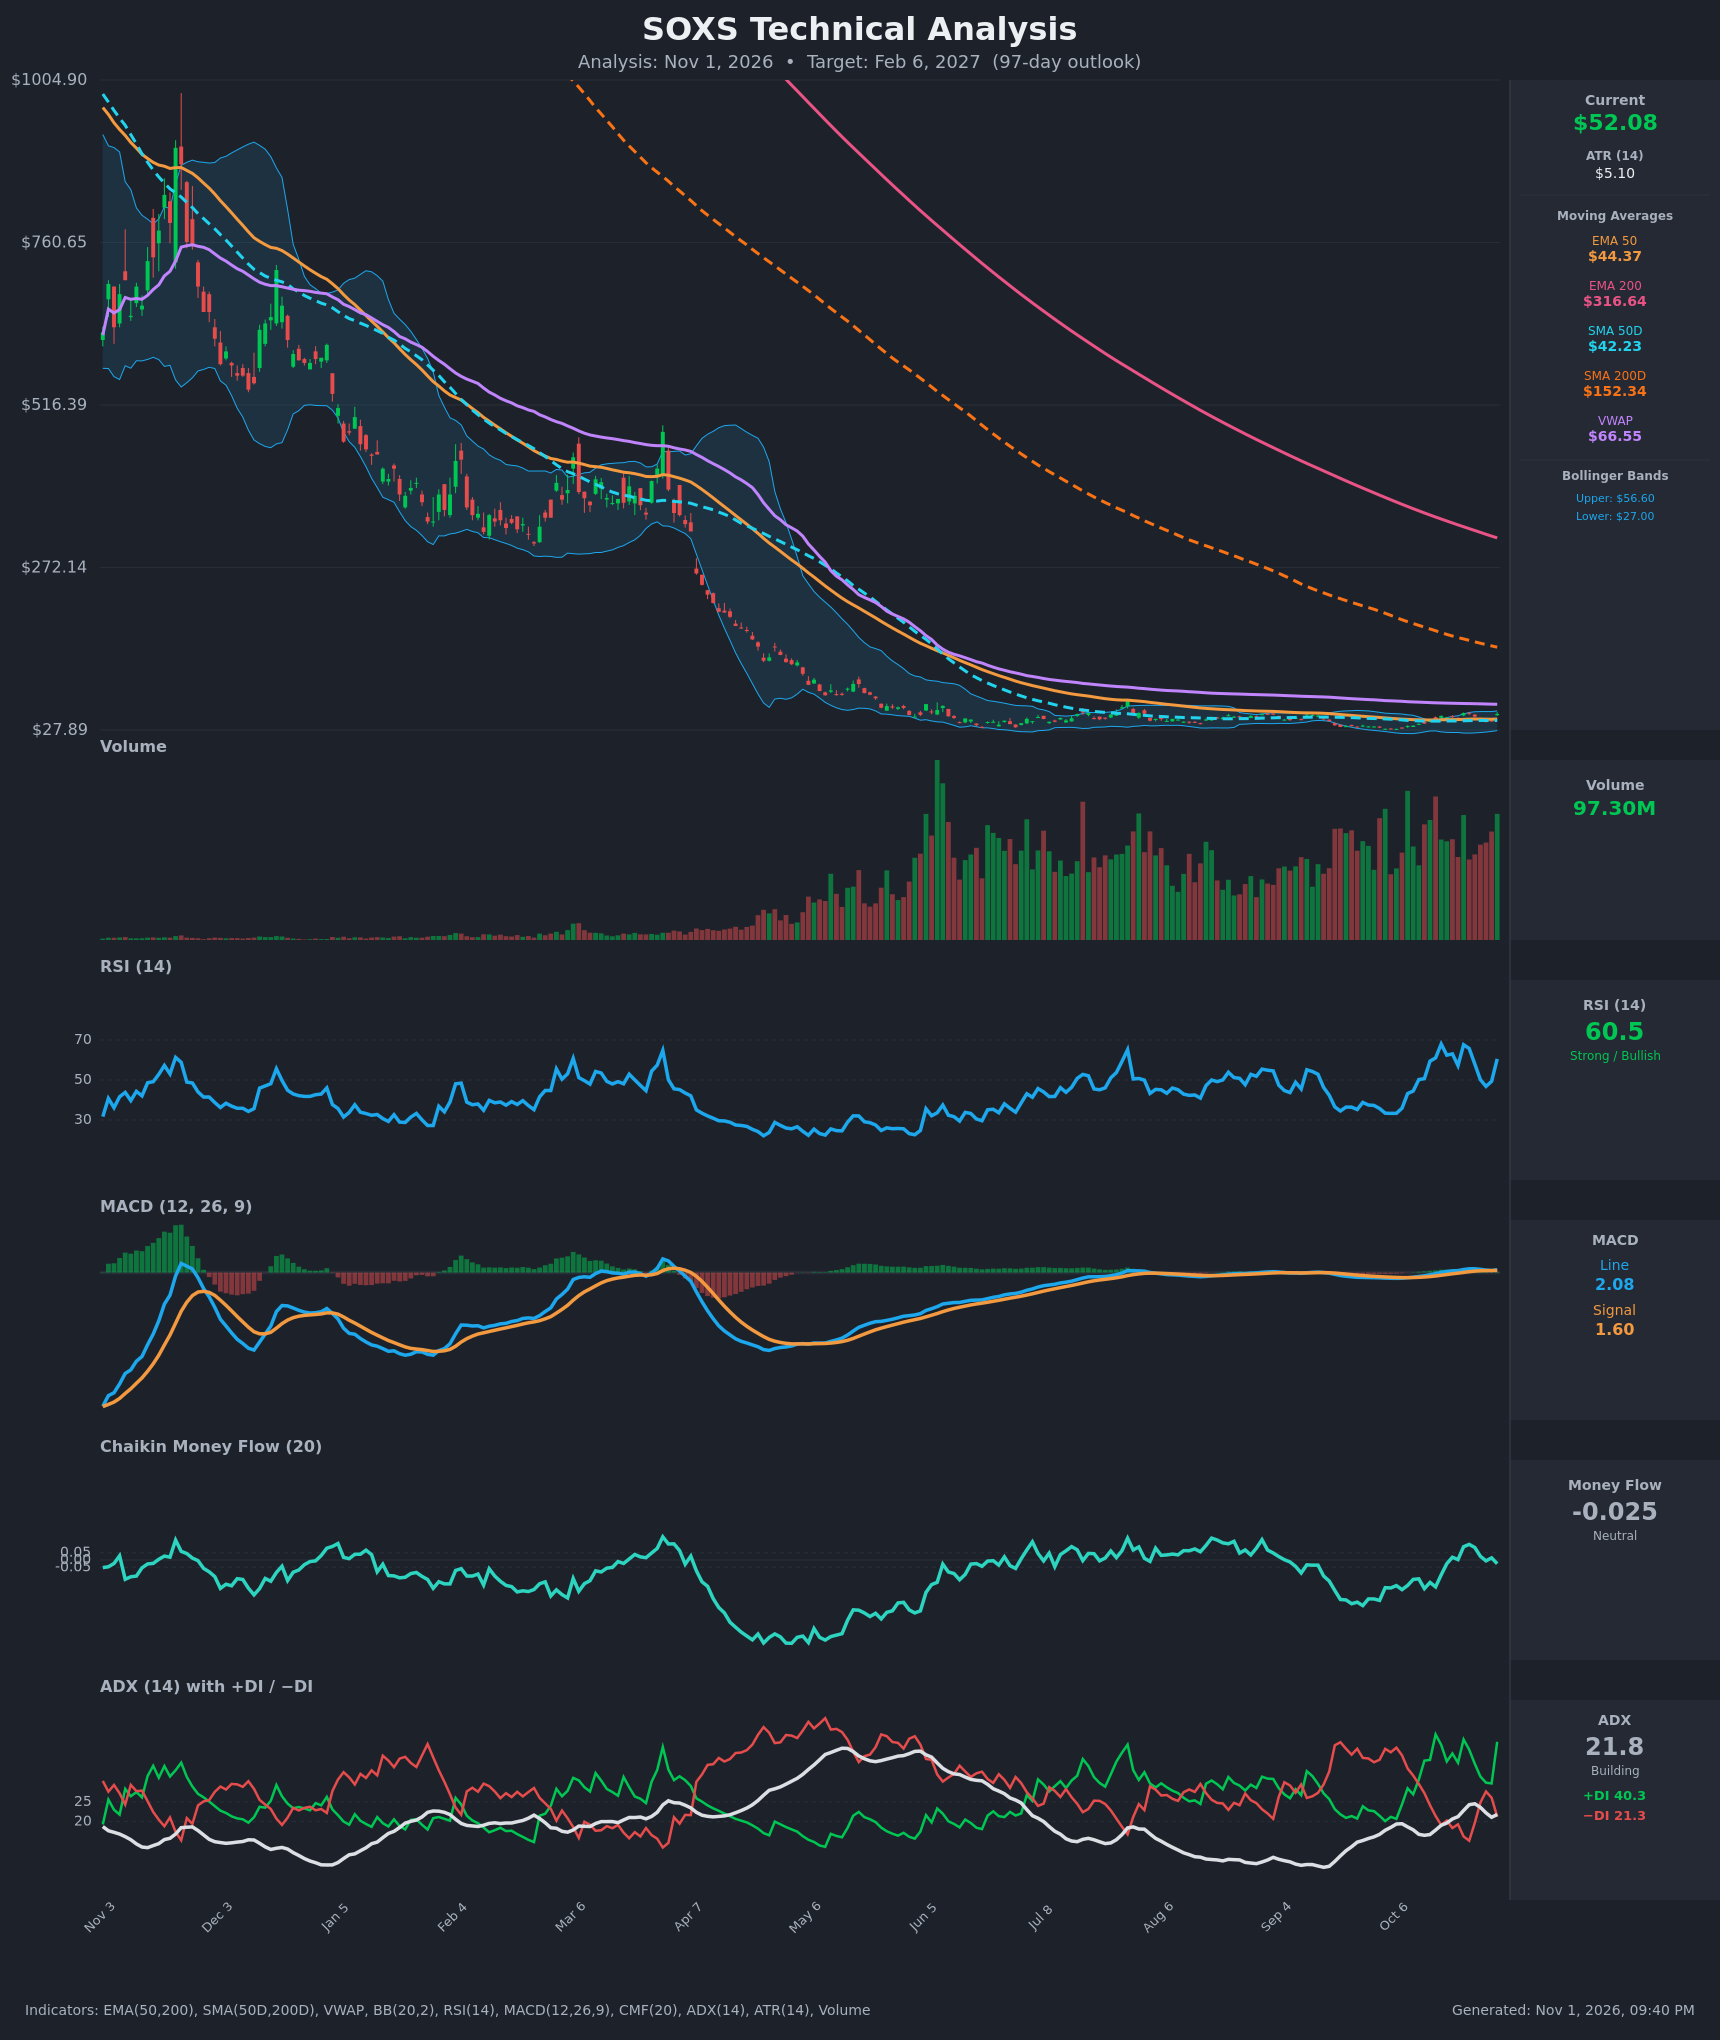
- RSI (14): 60.55, up from 49.4 two sessions ago. It is firm but below 70, and has made lower-to-flat highs (68.0 on Oct 16, 67.6 on Oct 22) before each pullback. [Bullish]
- 20 EMA: Not supplied. Using the EMA 50 ($44.38) and SMA 50 ($42.23) as the short-term trend gauges, price at $52.08 is above both, so both act as support. Price is far below the EMA 200 ($316.64) and SMA 200 ($152.34), which are overhead resistance in a long-term downtrend. [Bullish short-term / Bearish long-term]
- MACD: Line 2.084 is above signal 1.604, with a positive and widening histogram after the Oct 16-22 crossover. Both lines are barely above zero, so the momentum is shallow compared with the multi-month downtrend. [Bullish]
- Bollinger Bands (20): Upper $56.60, lower $27.00, so the bands are very wide. Price sits in the upper third, about $4.50 below the upper band, after a +25% one-day jump. Earlier spikes toward the upper half (Oct 16, Oct 22) were followed by 15-20% pullbacks. [Neutral to Bearish]
- CMF (20): -0.025, between ±0.05. It flipped from slightly positive (+0.106 on Oct 23) back to marginally negative despite the rally, so the buying has no volume-flow confirmation. [Neutral]
- ADX (14): 21.8, just above the 20 line and rising slowly from 16.7. +DI (40.3) is well above −DI (21.3), so bulls lead, but ADX is below 25 and the trend is not yet established. [Weak Trend, bullish tilt]
- Volume: 97.30M, near the highest recent levels on the chart. Volume has risen steadily since mid-year, which is typical of heavy trading in a leveraged ETF at a base. Up and down days both carry large volume, which signals a two-way fight rather than clean accumulation. [Neutral, high participation]
DIVERGENCES & TRENDS
- Price has made higher lows since the summer base ($27-30 area). The multi-month trend is still firmly down, with price below the EMA 200, SMA 200 and VWAP ($66.55).
- No clean RSI divergence. RSI peaks (68.0, 67.6, 60.5) are lower while price peaked at $49.23, then $53.45, then $52.08. This is mild bearish rolling momentum.
- MACD is in a bullish crossover that started Oct 16-22 and is still positive. It is flat relative to history, so it carries little weight.
- CMF has not confirmed the rally, staying around zero when price jumped.
- +DI/−DI: +DI crossed above −DI on Oct 14-15 and has stayed there except for the Oct 27-29 dip, when −DI briefly led.
- The EMA 50 ($44.38) is far below the EMA 200 ($316.64), and the SMA 50 ($42.23) is below the SMA 200 ($152.34). Both are death-cross configurations that remain intact, and the gaps are narrowing only because the 200s are falling.
- Price action is extremely whipsawy. Daily moves of 10-25% (e.g. $41.68 → $52.08) are common, and ATR is about 10% of price.
CHART PATTERNS
- Triple/Double Top-style range: Price has hit about $49-53 three times in two weeks (Oct 16 at $49.23, Oct 22 at $53.45, Oct 30 at $52.08) and fallen back toward $40 each time. This resembles a Bearish Triple Top or an expanding range under resistance. A close below roughly $37-40 would project a move toward the low $30s.
- Long-term base: On the chart, price has been flat near the bottom since mid-year, consistent with a Bullish Triple Top/range-base reversal. A confirmed breakout above $56.60 and then $60 would open the way toward the $66.55 VWAP.
- Structural context: This is a decaying 3x inverse ETF in a persistent downtrend, so the longer-term drift favors lower prices. The base is unconfirmed until price clears the $56-57 resistance.
POTENTIAL SCENARIOS
- Scenario 1: Bearish Rejection at Range Top — Price fails again near $53-57 and drifts back toward the EMA 50/SMA 50 zone as the longer-term downtrend and leveraged-ETF decay reassert. Trigger: daily close back below $44.38 (EMA 50). Target: $42 to $44, with an extension to $38. Invalidation: weekly close above $57. (45% probability)
- Scenario 2: Neutral Range Chop — Price stays in the $38-$56 range seen over the past month, with repeated whipsaws. Trigger: failure to break $56.60 or $39.78. Target: $45 to $52. Invalidation: close outside $37-$57. (28% probability)
- Scenario 3: Bullish Base Breakout — A close above the upper Bollinger Band ($56.60), with MACD, RSI and ADX trending higher, confirms a base breakout. Trigger: close above $56.60 on rising volume. Target: $62 to $66.55 (VWAP). Invalidation: close below $42.23. (27% probability)
PRICE TARGETS
- Target Price: $44.50 (97 days)
- Expected Range: $38.00 to $54.00 (width $16.00, about 31% of current price, consistent with the 61-180 day guidance)
- Key Levels: Support at $42.23, Resistance at $56.60
OVERALL BIAS
OVERALL BIAS: BEARISH - Price is stalling under repeated resistance at $49-57. RSI peaks are lower, CMF has not confirmed the rally, ADX is below 25, and the long-term structure (below the SMA 200, EMA 200 and VWAP, with leveraged-ETF decay) favors a drift lower toward the EMA 50/SMA 50 zone. Conviction is modest because short-term momentum (MACD, +DI) is bullish.
This is educational analysis and not financial advice.