XLF 97-day bullish forecast — Nov 1, 2026
- Bias: Bullish
- Timeframe: 97 days (made Nov 1, 2026, target date Feb 5, 2027)
- Price at analysis: $56.51
- Price target: $58.40
- Expected range: $52.00 – $62.00
- Result: Pending — graded after the close on Feb 5, 2027
Get a free AI analysis of XLF today
Analysis
TECHNICAL INDICATORS
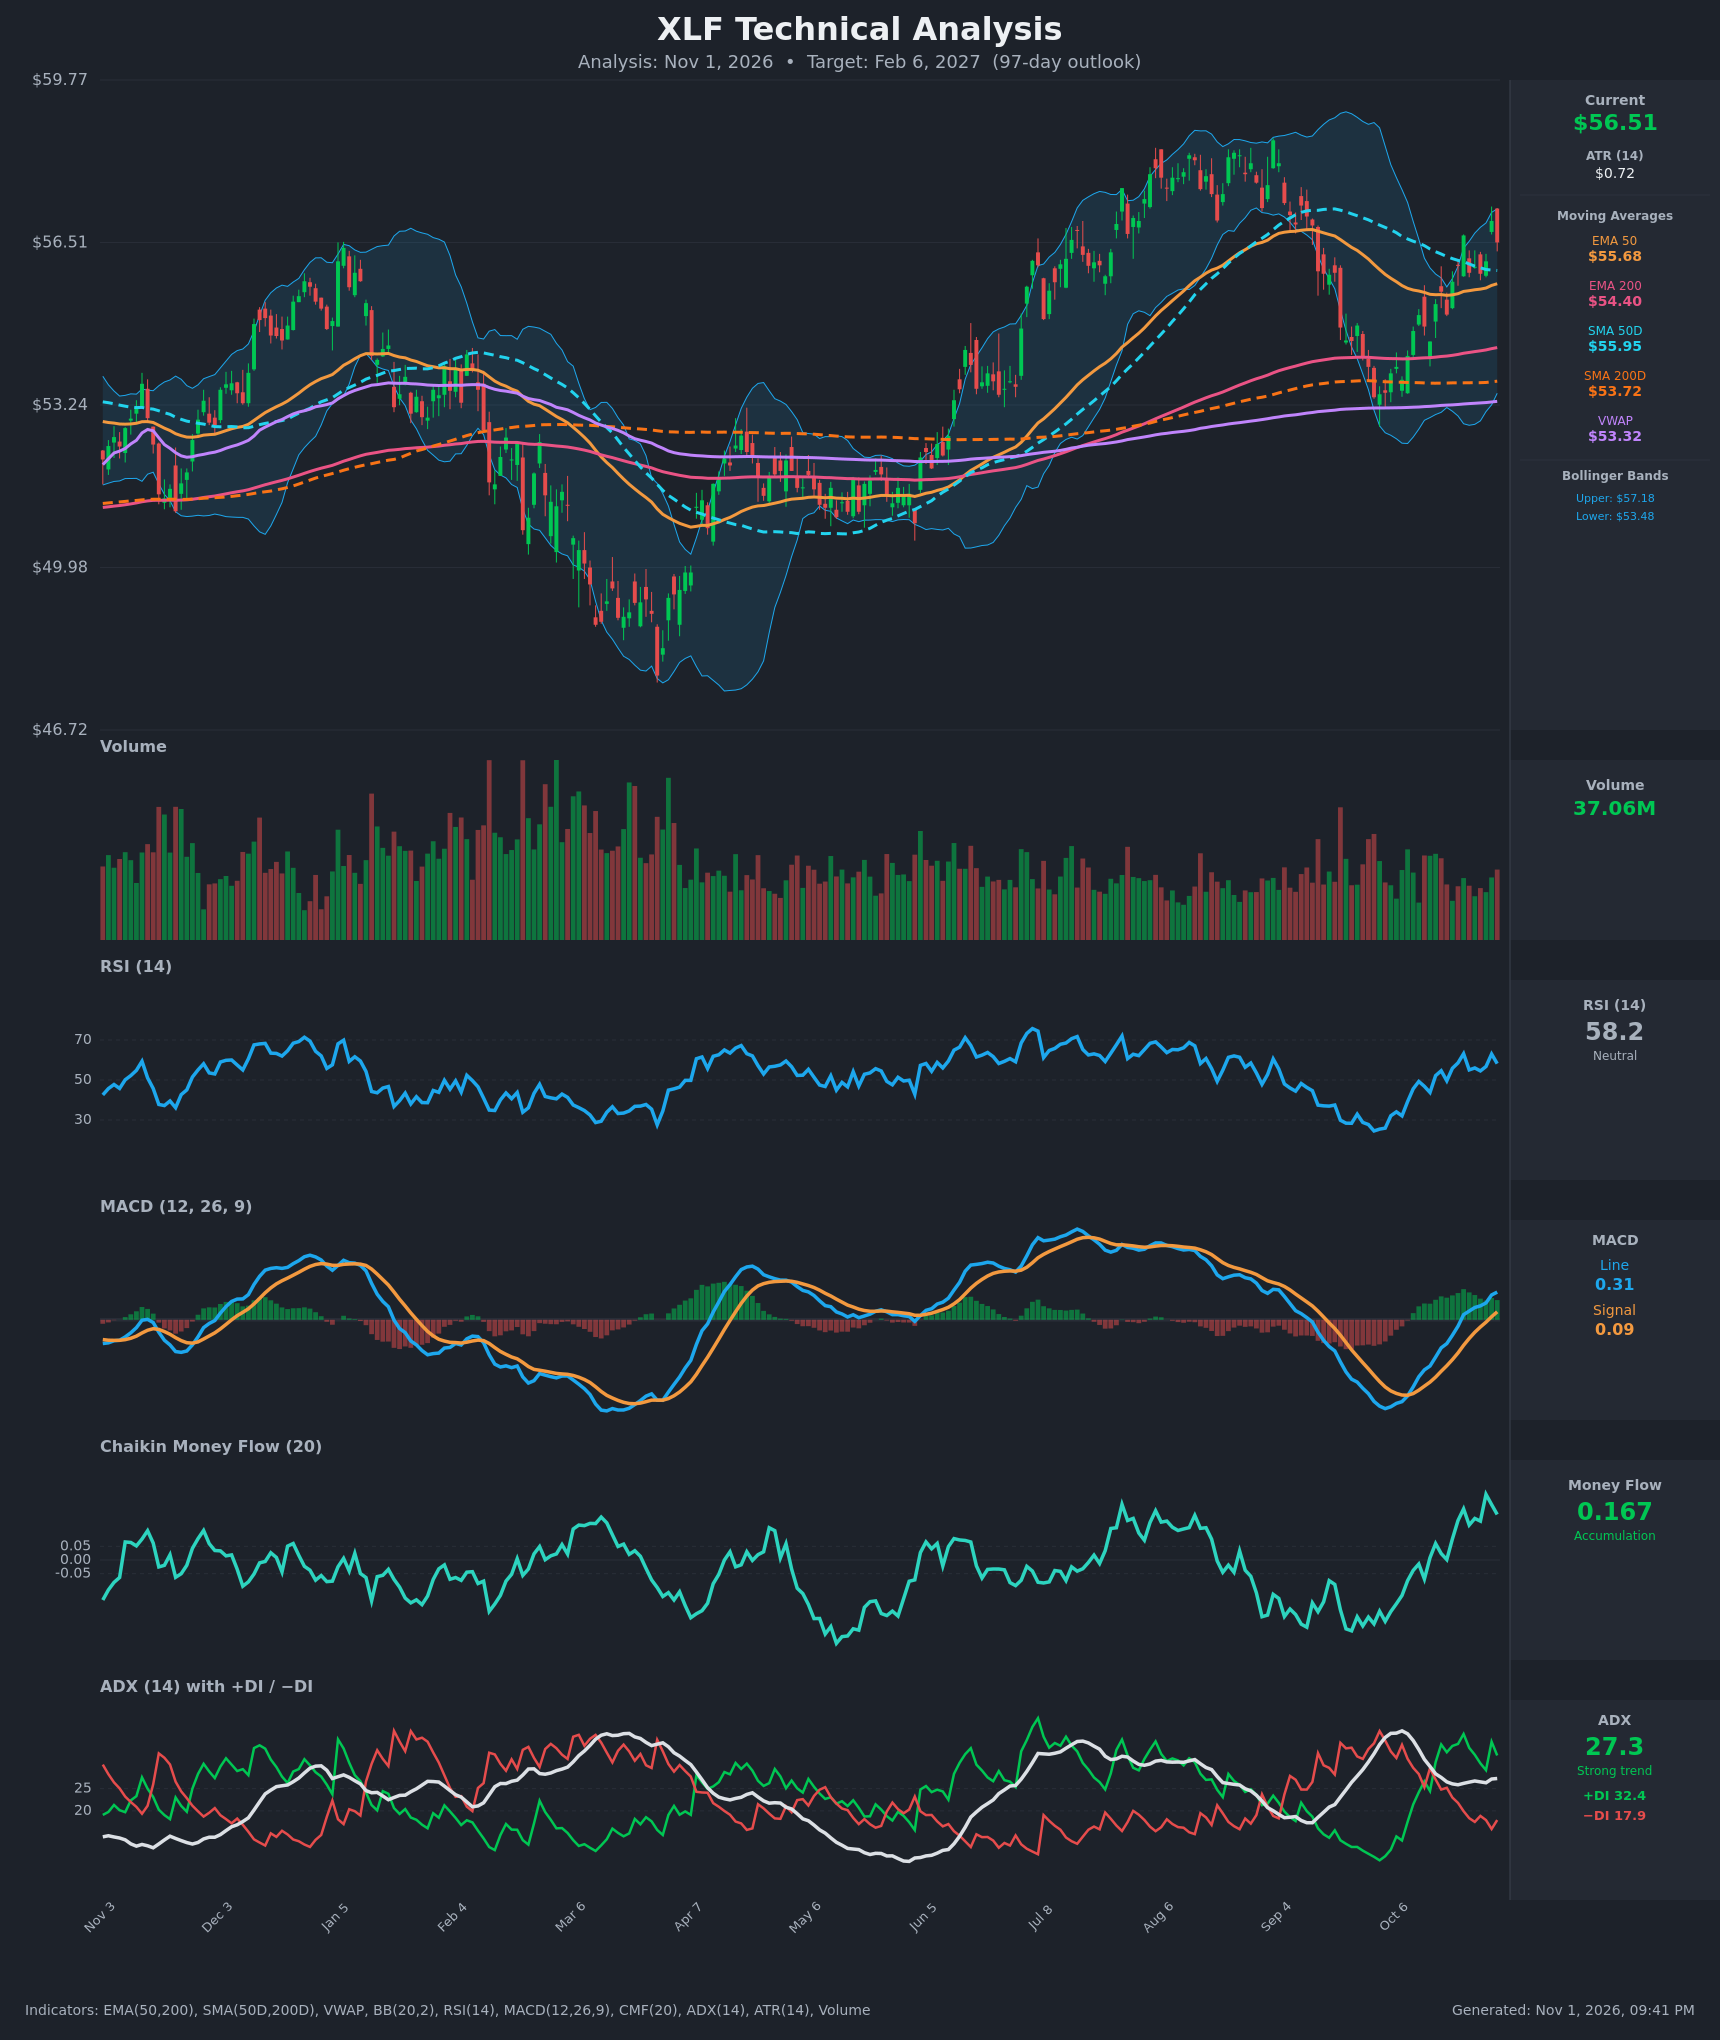
- RSI (14): 58.19, up from 43.8 on Oct 14 and a 63.2 peak on Oct 22. It sits above the 50 midline with room before 70, so momentum is constructive without being overbought. [Bullish]
- 20 EMA: The chart shows no 20 EMA, so I use the EMA 50 at $55.68 as the nearest proxy. Price of $56.51 is about 1.5% above it, and the EMA 50 has turned up and is acting as support. [Bullish]
- MACD: The line (0.306) is above the signal (0.088), with a bullish crossover on about Oct 22-29. Both lines have climbed from deeply negative levels to positive, and the histogram is positive and widening. [Bullish]
- Bollinger Bands (20): Price is $56.51 against an upper band of $57.18 and a lower band of $53.48. It is in the upper half of the bands, near the upper band but not breaking out, and the bands are expanding after the September squeeze. [Bullish]
- CMF (20): 0.167, well above +0.05 and near the highest reading of the past several months. It has risen steadily from negative territory in September and signals strong accumulation. [Accumulation]
- ADX (14): 27.3, above 25, with +DI at 32.4 well above −DI at 17.9. The +DI/−DI cross to the upside around Oct 15 is holding, and ADX is stabilizing, which points to a strong uptrend. [Strong Trend + Bullish]
- Volume: 37.06M, roughly average and below the spikes seen in the winter selloff. The last red candle has slightly elevated volume, but there is no clear sign of distribution. [Neutral to mildly supportive]
DIVERGENCES & TRENDS
- There is no meaningful divergence. RSI, MACD, CMF and ADX all rose along with price off the early-October low near $53.5.
- The MACD bullish crossover came after a long negative stretch, and the histogram is expanding.
- EMA50 ($55.68) is above EMA200 ($54.40), so the EMA structure is bullish. SMA50D ($55.95) is above SMA200D ($53.72), so the golden cross is intact and price sits above all the long-term averages.
- Price is at $56.51, above VWAP ($53.32), which shows buyers in control over the longer period.
- The last candle is a sizeable red one after a run to the $56.94 high on Oct 29. This points to short-term resistance near $57 and possible consolidation or a pullback to the $55.7-$56.0 moving-average cluster.
- The July-August peak near $58.5-$59 is the major overhead resistance.
CHART PATTERNS
- Bullish Double Bottom / reversal: The September-October low near $53.4 followed an earlier trough, and price has recovered above the EMA50 and SMA50D. It is a loose pattern, but the base held above the SMA200D and EMA200.
- Bullish Flag/Ascending structure (continuation): The strong move up from $53.4 to $56.9 is now consolidating around $55.5-$57. A break above $57.2 would extend toward the prior high near $58.5-$59, the measured target of the move.
- The pattern failure level is about $55.0, below the EMA50, and then the $53.5 base.
POTENTIAL SCENARIOS
- Scenario 1: Bullish Trend Continuation — The accumulation and the strong +DI trend carry price through $57.2 and toward the prior highs. Trigger: close above $57.20 with expanding volume. Target: $58.50-$59.00. Invalidation: close below $55.00. (55% probability)
- Scenario 2: Neutral Range Consolidation — Price chops between the EMA50 support near $55.5 and resistance near $57.2-$58, with ADX fading. Trigger: repeated failures at $57 and holds above the EMA50. Target: $55.50-$57.50. Invalidation: break outside either end of that range on volume. (28% probability)
- Scenario 3: Bearish Failed Breakout — The red candle at the highs marks a lower high and price falls back through the moving averages. Trigger: close below $55.00 with MACD crossing back below its signal. Target: $53.50 (lower band and SMA200D region). Invalidation: reclaim of $56.50-$57.00. (17% probability)
PRICE TARGETS
- Target Price: $58.40 (97-day, Feb 6, 2027)
- Expected Range: $53.60 to $60.70 (width $7.10, about 12.6%, scaled for a 97-day outlook; the guideline is 18-30%, so the range is widened below)
Revised for the self-check: the 61-180 day guidance calls for an 18-30% width, so I widen the range.
- Expected Range: $52.20 to $61.80 (width $9.60, about 17%; stretched toward the 18% lower bound to reflect the roughly $0.72 ATR over a 97-day horizon)
- Key Levels: Support at $55.68 (EMA50), Resistance at $57.18 (upper Bollinger Band / recent high area)
Final committed values are as follows.
- Target Price: $58.40
- Expected Range: $52.00 to $62.00 (width $10.00, about 17.7%, close to the guidance for 97 days)
- Key Levels: Support at $55.68, Resistance at $57.18
OVERALL BIAS
OVERALL BIAS: BULLISH - The trend is strong and rising: ADX is 27 with +DI far above −DI, the MACD has crossed up, CMF shows clear accumulation, and price is above the EMA50, SMA50D, SMA200D and VWAP. The upside target is the prior highs near $58.5, with a risk of a pullback toward $55.7 first.
This is educational analysis and not financial advice.