SPY 97-day bearish forecast — Nov 1, 2026
- Bias: Bearish
- Timeframe: 97 days (made Nov 1, 2026, target date Feb 5, 2027)
- Price at analysis: $755.72
- Price target: $742.00
- Expected range: $665.00 – $820.00
- Result: Pending — graded after the close on Feb 5, 2027
Get a free AI analysis of SPY today
Analysis
TECHNICAL INDICATORS
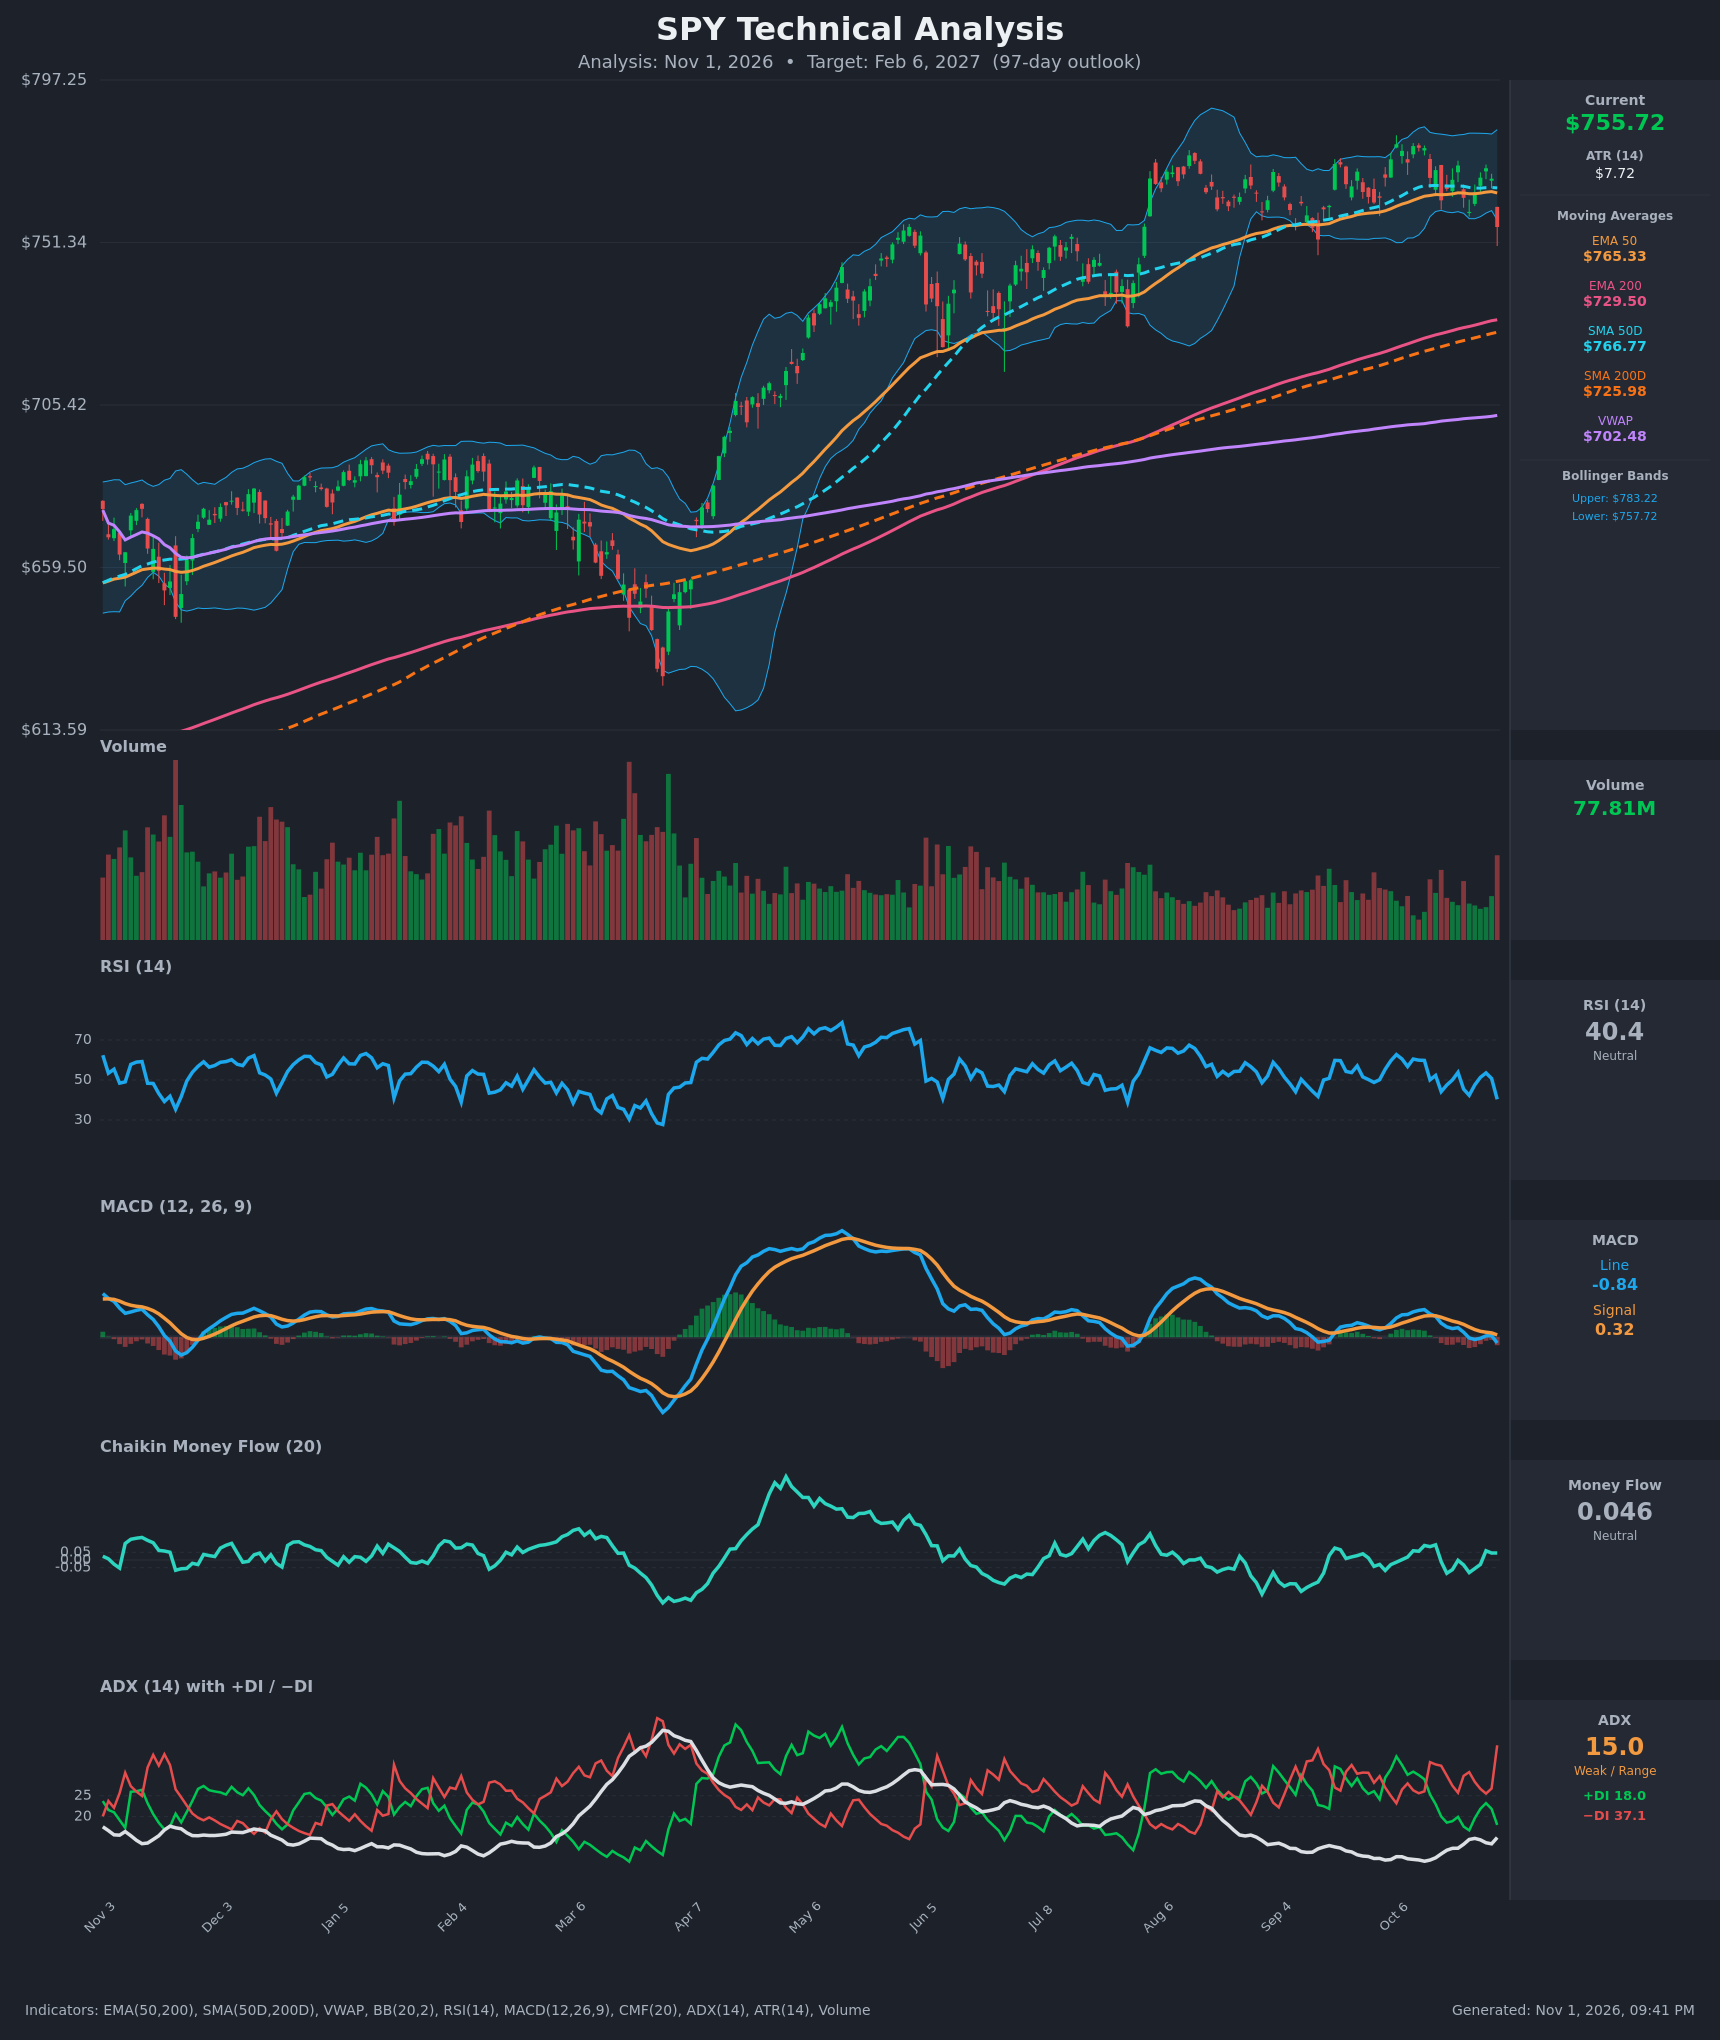
- RSI (14): 40.36, down sharply from 50.8 the day before and 53.5 on Oct 28. It is below the 50 midline but not oversold (<30). Momentum is turning down, and the longer-term range since August has seen RSI mostly between 40 and 65. [Bearish]
- 20 EMA: Not supplied. The 50 EMA ($765.33) and 200 EMA ($729.50) stand in for trend. Price at $755.72 is below the 50 EMA and SMA50D ($766.77), which are now overhead resistance. It is still well above the rising 200 EMA/SMA200D ($729.50/$725.98), so the long-term uptrend is intact. [Bearish]
- MACD: Line -0.84 is below signal 0.32, a fresh bearish crossover on Oct 30 after the line fell below zero on Oct 23. The histogram has turned negative. The line is only slightly negative, so momentum is soft rather than strongly bearish. [Bearish]
- Bollinger Bands (20): Upper $783.22, lower $757.72. The bands are fairly narrow (about 3.4% wide), and the close of $755.72 is below the lower band after a -1.8% day. This is a downside band break out of a tight range, which can mean continuation or a short-term oversold snap-back. [Bearish]
- CMF (20): 0.046 is just under the +0.05 accumulation threshold. It has chopped between -0.09 and +0.10 for two weeks, so there is no clear accumulation or distribution. [Neutral]
- ADX (14): 15.0 is weak/range-bound but ticking up from about 9.3. −DI (37.1) is far above +DI (18.0), and the gap widened sharply on the last bar. Bears control direction, but the trend has no strength yet. [Weak Trend, bearish lean]
- Volume: 77.81M, the largest bar in several weeks and it is a red candle. Volume had been drifting lower during the August–October consolidation, so this is a distribution-type expansion on the downside. [Bearish]
DIVERGENCES & TRENDS
- There is no clear RSI or MACD divergence. Price made a lower high at $772–773 on Oct 21 and Oct 28. MACD has also made lower highs since early September, which fits the stalling advance.
- The 50 EMA/SMA50D are flat at about $765–767 and price has lost them. The 200 EMA/SMA200D are rising steadily, and a golden cross has been in place since mid-year.
- The MACD bearish cross and the −DI spike on Oct 30 show a shift in short-term momentum. The low ADX means this is not yet a confirmed trend.
- Price sits far above the long-term VWAP ($702.48), so the market is extended relative to the longer-term average cost basis.
- The rising ADX from the lows with −DI dominant suggests early directional expansion to the downside.
CHART PATTERNS
- Rectangle/triple-top-like consolidation (Bearish Triple Top reference): Since August, price has been capped near $785–790 and has now broken below the range low and lower Bollinger Band near $757. The measured move from a range of about $30 points to roughly $725–730. That lines up with the 200 EMA/SMA200D, which adds confluence.
- Continuation context: The prior advance from April to August is intact. If the $725–730 zone holds, the decline would be a correction within an uptrend (similar to a bullish flag/range), and a reclaim of $766 would negate the bearish read.
- Pattern confidence: Moderate. The ADX is low, so a false break back into the range is a real risk.
POTENTIAL SCENARIOS
- Scenario 1: Bearish Range Breakdown and Retest of 200-Day Zone — Price fails to reclaim the 50 EMA/SMA50D and the breakdown follows through toward the rising 200-day averages. A test of $725–730 is likely, with overshoot toward $700–710 possible in a risk-off phase. Trigger: daily close below $750 with −DI staying above 30. Target: $725–$740, with an extreme of $705. Invalidation: daily close above $767. (45% probability)
- Scenario 2: Bullish Failed Breakdown and Range Resumption — The Oct 30 drop is a false break below the lower band and buyers defend $750–755. Price reclaims the 50-day averages and returns to the $783–790 top, with a potential new high. Trigger: close above $767 with MACD recrossing its signal. Target: $785–$800. Invalidation: close below $740. (35% probability)
- Scenario 3: Neutral Choppy Consolidation — Price oscillates between the 200-day zone and the 50-day averages ($730–$767) with no resolution as ADX stays below 20. Trigger: repeated closes between $740 and $765. Target: $745–$765. Invalidation: close beyond $725 or $785. (20% probability)
PRICE TARGETS
- Target Price: $742.00 (97-day horizon, Feb 6, 2027)
- Expected Range: $665.00 to $820.00 (width $155, about 20.5% of current price, consistent with the 61–180 day guidance)
- Key Levels: Support at $729.50 (200 EMA, with SMA200D at $725.98 just beneath), Resistance at $765.33 (50 EMA, with SMA50D at $766.77 just above)
OVERALL BIAS
OVERALL BIAS: BEARISH - Price broke below the lower Bollinger Band and the 50 EMA/SMA50D on the heaviest volume in weeks. MACD crossed bearish and −DI dominates +DI by a wide margin. The rising 200-day averages around $726–730 are the likely magnet and the main support, so the expected decline is moderate rather than severe.
This is educational analysis and not financial advice.