SPY 46-day bearish forecast — Nov 2, 2026
- Bias: Bearish
- Timeframe: 46 days (made Nov 2, 2026, target date Dec 18, 2026)
- Price at analysis: $760.93
- Price target: $752.00
- Expected range: $706.00 – $800.00
- Result: Pending — graded after the close on Dec 18, 2026
Get a free AI analysis of SPY today
Analysis
TECHNICAL INDICATORS
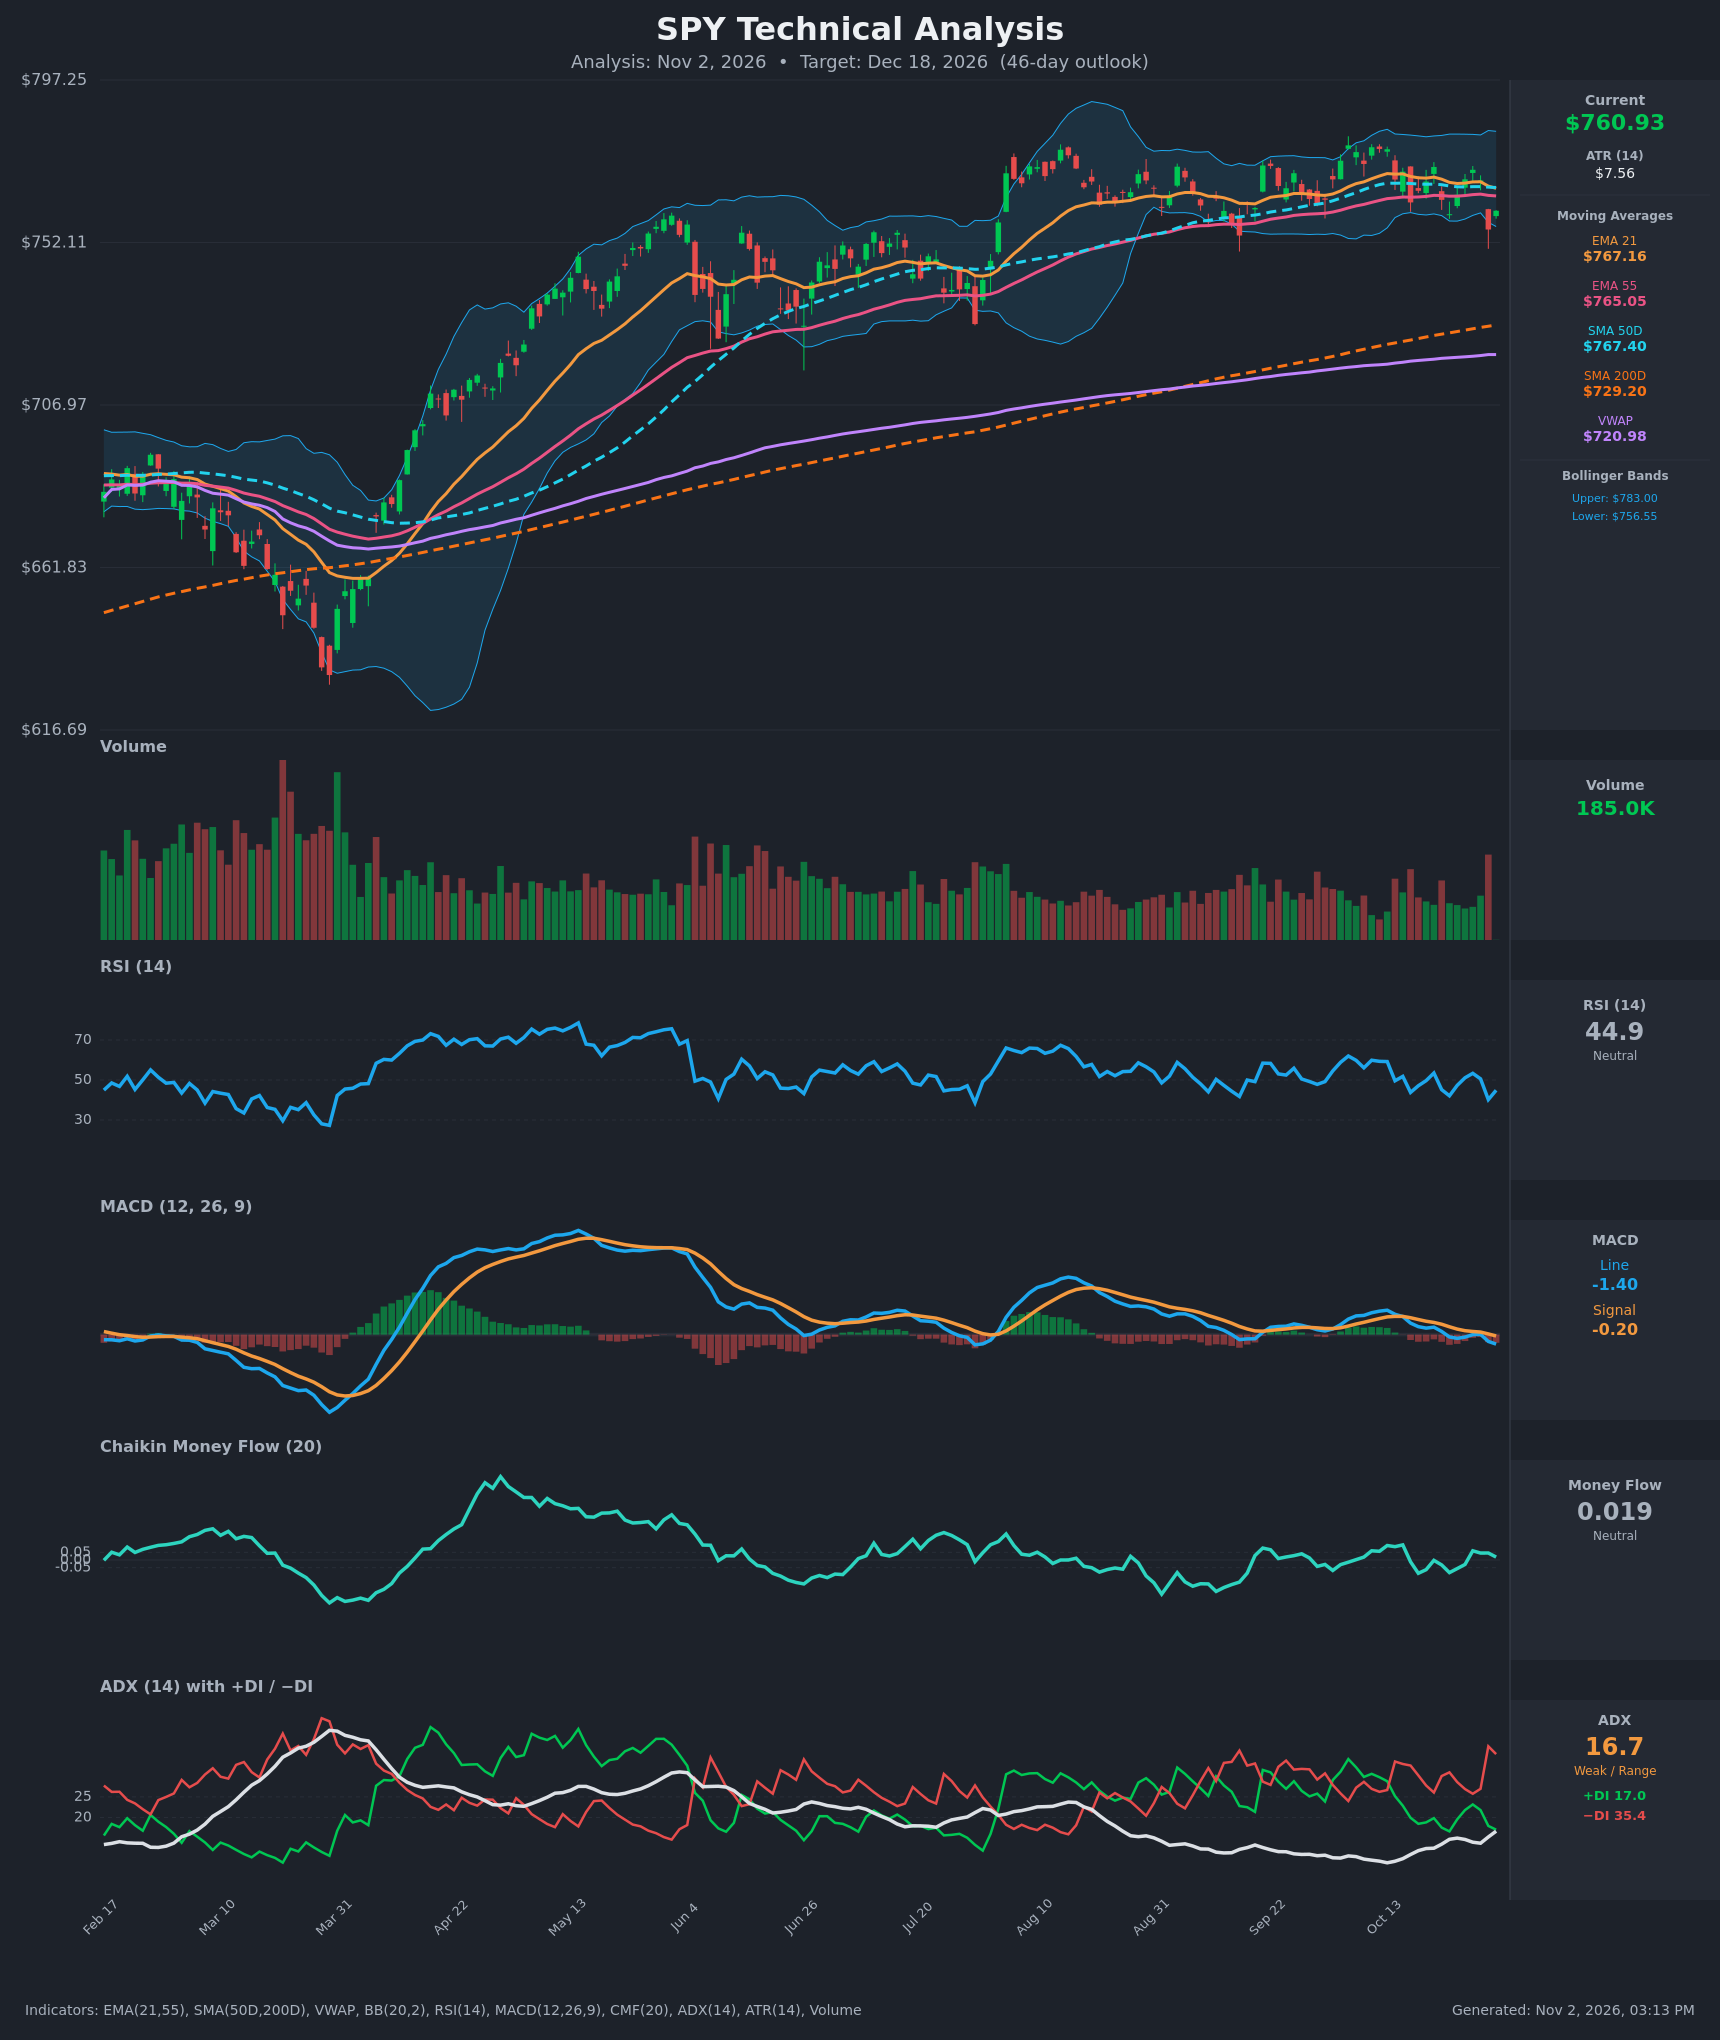
- RSI (14): 44.86, below the 50 midline and well off the Oct 13 reading of 59. Momentum has been choppy but is tilting down, with lower RSI peaks at 53.5 on Oct 21 and 53.3 on Oct 28. It is not oversold. [Bearish]
- 20 EMA: The EMA 21 is $767.16 and price at $760.94 is below it, so it acts as resistance. Price is also below the EMA 55 ($765.05) and the SMA 50D ($767.40). The EMA 21 is rolling over and converging toward the EMA 55, but no bearish cross has happened yet. [Bearish]
- MACD: The line is -1.40 and the signal is -0.20, so the line is below the signal and below zero. The bearish crossover came around Oct 23-26 and the negative histogram is widening, which shows accelerating downside momentum. [Bearish]
- Bollinger Bands (20): Upper $783.00, lower $756.55. Price at $760.94 sits in the lower quarter of the bands, just above the lower band after the Oct 30 drop to $755.72. The bands are fairly narrow, which fits a consolidating market. A close below the lower band would signal continued weakness. [Bearish]
- CMF (20): 0.019 sits between -0.05 and +0.05, so money flow is neutral. It has faded from +0.099 on Oct 15 and flipped between slightly positive and slightly negative since, which shows no real accumulation. [Neutral]
- ADX (14): 16.7 is below 20, so the trend is weak or range-bound. It is rising from about 9 to 16.7, which shows trend strength building. −DI (35.4) is far above +DI (17.0), so sellers dominate the directional movement. [Weak Trend, bearish direction]
- Volume: The latest reading is 185.0K. The Oct 30 sell-off came with a visible volume spike, which is the largest red bar in months. Heavy volume on a down day, with no matching buying surge, leans bearish. [Distribution-leaning, bearish]
Other levels:
- SMA 200D: $729.20 and rising. Price is about 4% above it, so the long-term uptrend is intact.
- VWAP: $720.98, well below price, which is a longer-term bullish backdrop.
- SMA 50D vs SMA 200D: The 50D is above the 200D, so there is no death cross.
DIVERGENCES & TRENDS
- Price has made roughly flat-to-lower highs since mid-October ($778 → $773 → $772). RSI peaks and MACD peaks have fallen even faster, which is mild bearish momentum confirmation, not a true divergence.
- The MACD bearish crossover and the −DI surge (from 25.8 to 35.4 over the last four bars) point to short-term deterioration.
- EMA 21 ($767.16) is declining toward EMA 55 ($765.05). A cross below would add a bearish signal, but the gap is only about $2.
- Price is below the SMA 50D, EMA 21 and EMA 55. This is the first sustained loss of the short-term MAs in months, though price is still far above the SMA 200D.
- Since August, price has been in a $750-$785 band with little net progress, which explains the low ADX. Against that, the MACD, DI and moving-average signals all point down.
- CMF is flat and shows no accumulation, so there is no sign of dip buying yet.
CHART PATTERNS
- Rectangle / consolidation range: The best fit is a sideways range of roughly $750-$785 since August. A break below ~$750 would target about $729 (SMA 200D) and potentially $715 on a measured move.
- Bearish double top (loose): Highs near $778 (Oct 13) and $772-773 (Oct 21/28) form a rounded double-top-like structure. The neckline is the ~$750-$756 area. A decisive close below it would confirm the pattern, with a target near $725-$730.
- Symmetrical triangle (weak): Lower highs and a flat floor near $750-$756 suggest compression. A break below favors continuation of the recent selling, while a reclaim of $772+ would negate it.
- None of these patterns is fully confirmed. The long-term uptrend means breakdown targets are likely to find support near the SMA 200D.
POTENTIAL SCENARIOS
- Scenario 1: Bearish Range-Floor Breakdown — Sellers keep control (−DI at 35 vs +DI at 17, MACD negative, price below the EMAs). Price loses the $756 lower band and the ~$750 floor, then drifts toward the rising SMA 200D area. Trigger: daily close below $750. Target: $735-$740, with extension to $729. Invalidation: daily close back above $768 (SMA 50D / EMA 21). (45% probability)
- Scenario 2: Bullish Range Recovery — The long-term uptrend reasserts. Price holds the $750-$756 floor, RSI turns up from the mid-40s, and price rebuilds toward the range top. Trigger: close above $767.40 with CMF rising above +0.05. Target: $778-$785. Invalidation: close below $750. (35% probability)
- Scenario 3: Neutral Chop — Weak ADX and compressed bands keep price between $750 and $772 for the whole window. Trigger: repeated failures at $767-$772 and bounces at $750-$756. Target: $755-$765. Invalidation: a close outside $745-$775. (20% probability)
PRICE TARGETS
- Target Price: $752.00 (46 days, around Dec 18, 2026)
- Expected Range: $706.00 to $800.00 (width $94, about 12.4% of the current price, in line with the 30-60 day guidance)
- Key Levels: Support at $750.00, Resistance at $767.40
OVERALL BIAS
OVERALL BIAS: BEARISH - Short-term evidence outweighs the long-term backdrop: price is below the EMA 21, EMA 55 and SMA 50D, MACD has crossed bearishly, −DI dominates +DI, and the latest drop came on heavy volume. The bias is modest because ADX is weak, the SMA 200D is far below, and price is still in a multi-month range, so the downside is likely a drift toward the lower range and SMA 200D area, not a collapse.
This is educational analysis and not financial advice.