GOOGL 5-day bearish forecast — Nov 2, 2026
- Bias: Bearish
- Timeframe: 5 days (made Nov 2, 2026, target date Nov 6, 2026)
- Price at analysis: $282.35
- Price target: $277.50
- Expected range: $270.00 – $288.00
- Result: Incorrect (+1.1%) — closed at $285.49 on Nov 6, 2026; quality score 46/100
Get a free AI analysis of GOOGL today
Analysis
TECHNICAL INDICATORS
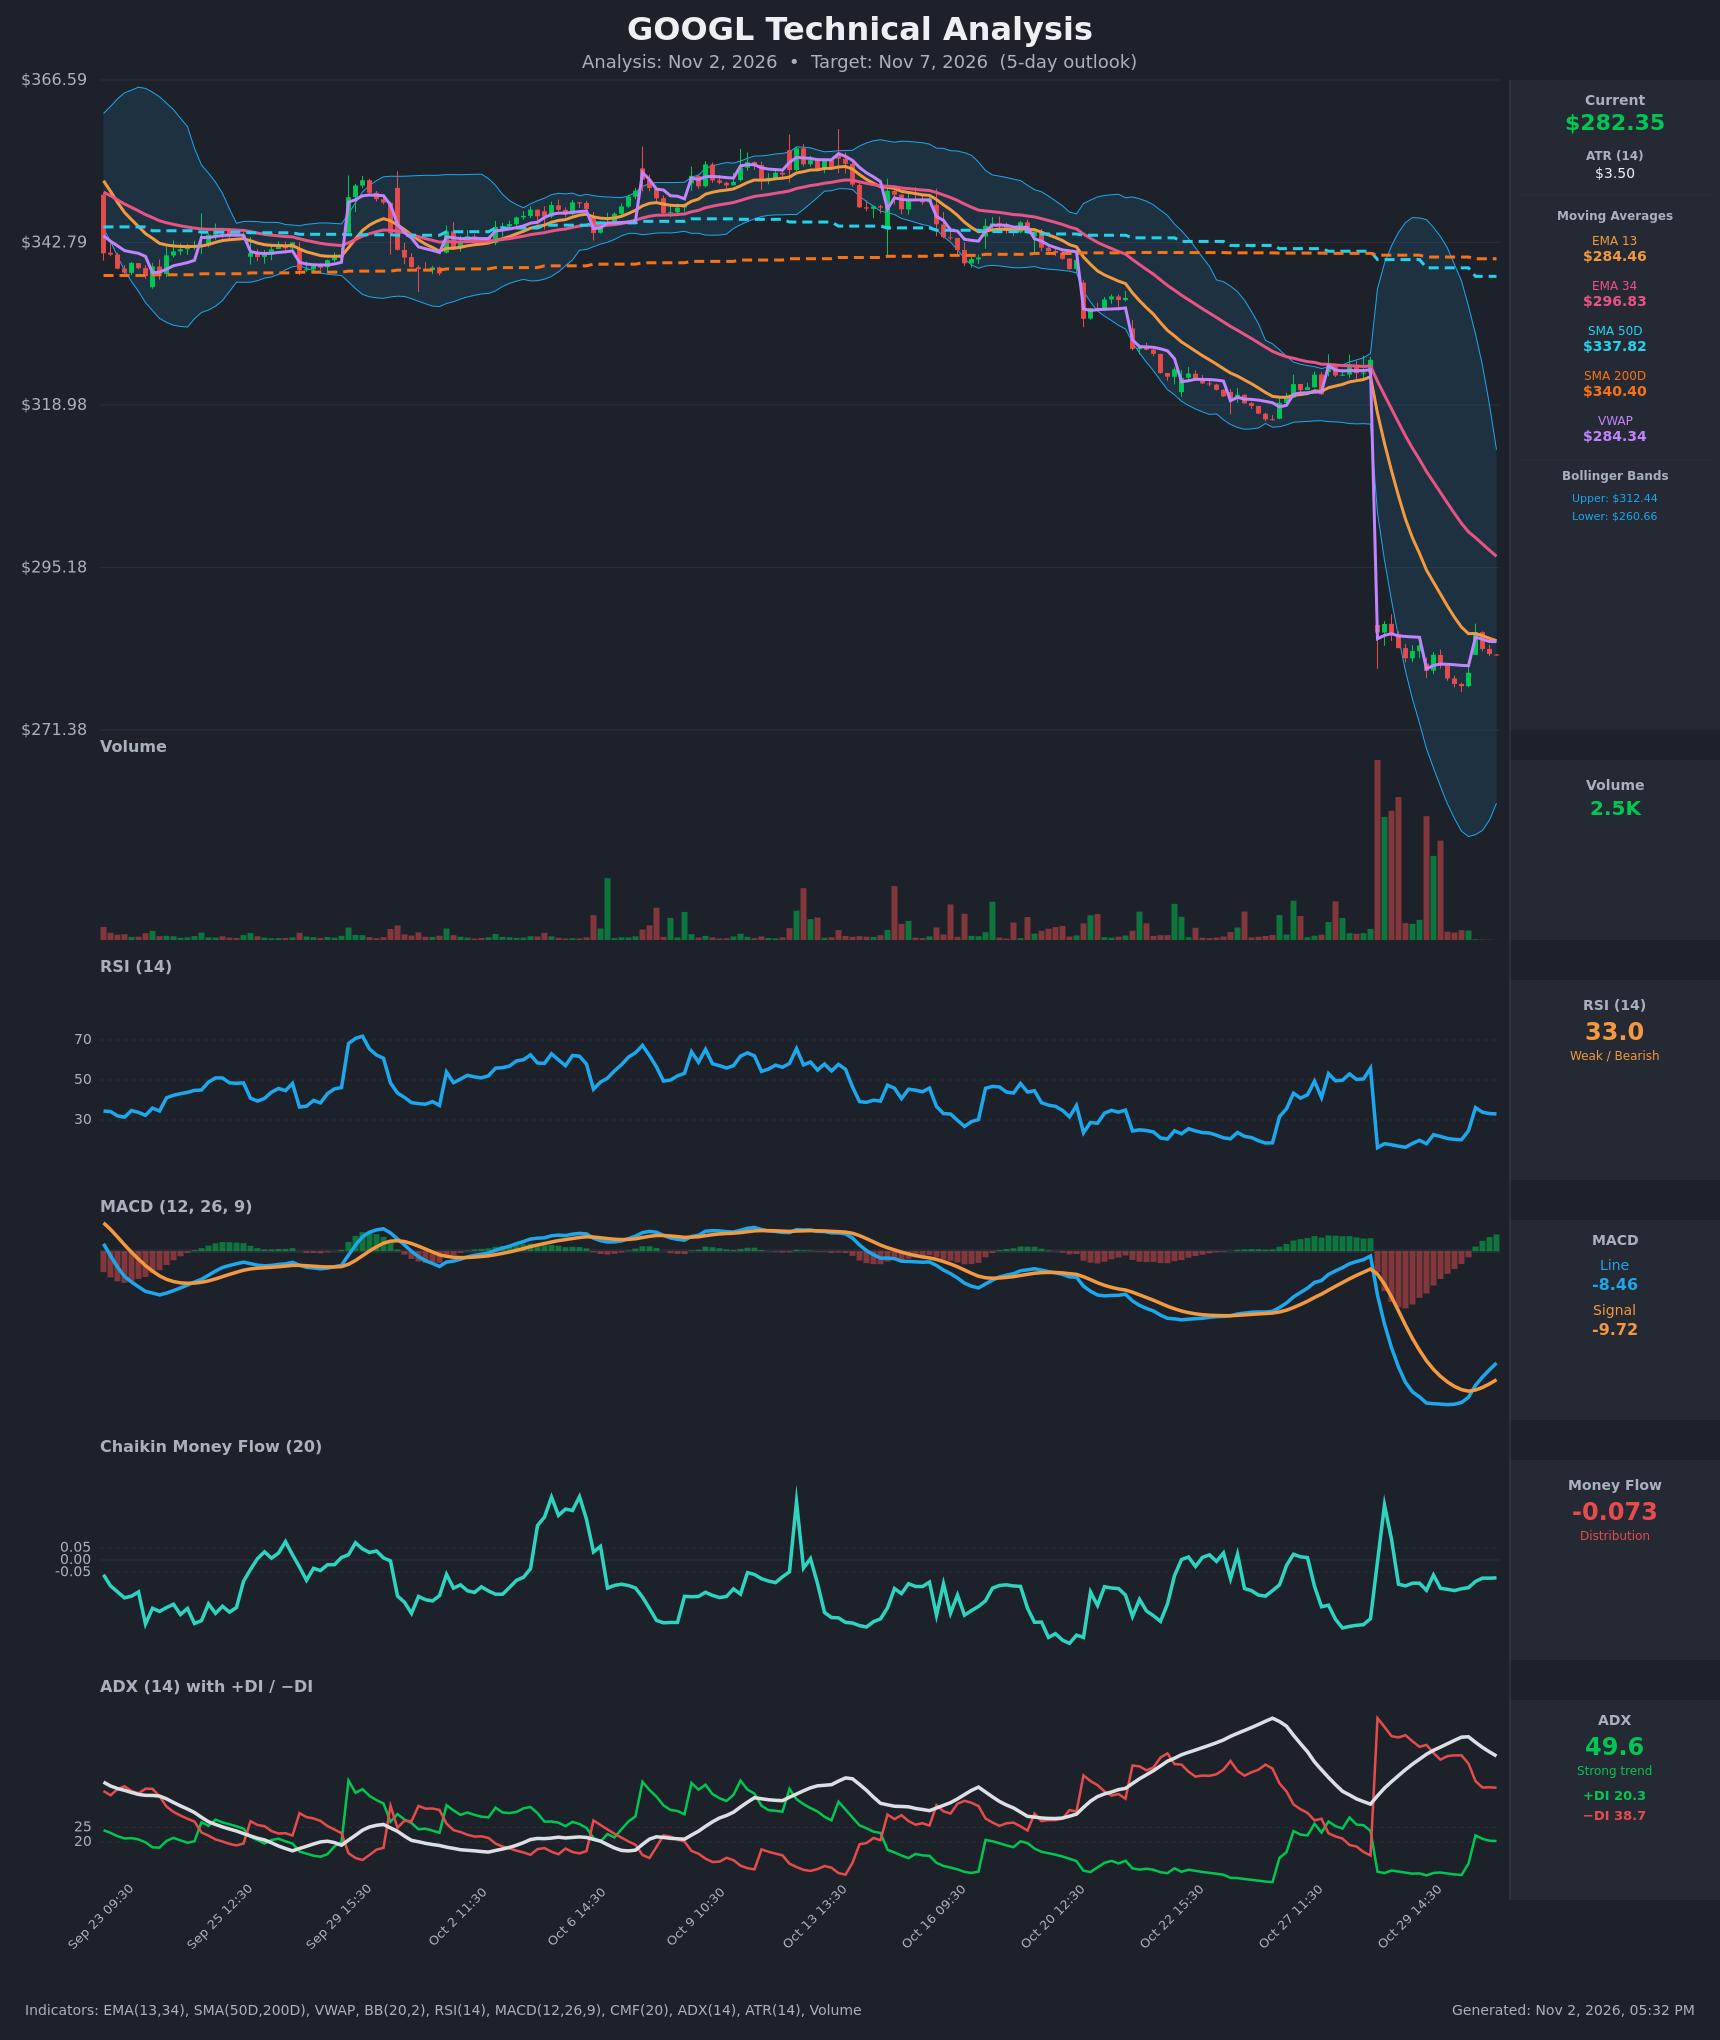
- RSI (14): 33.05, rebounding from deeply oversold readings (16-20 on Oct 29-30) but stalling just above 30 and failing to reach 50. Momentum is recovering from an extreme but remains weak. [Bearish]
- 20 EMA: The supplied EMAs are EMA13 at $284.46 and EMA34 at $296.83. Price ($282.35) is below both, and EMA13 sits right on top of price as immediate resistance. EMA13 is below EMA34, so the bearish alignment is intact. [Bearish]
- MACD: Line -8.46 vs signal -9.72, giving a small positive histogram of about +1.26. The line crossed above the signal on Nov 2 09:30, a bullish crossover. It is still deep below zero, so this reads as a relief bounce, not a trend change. [Neutral]
- Bollinger Bands (20): Upper $312.44, lower $260.66, midline about $286.55. The bands are extremely wide after the gap-down. Price is below the midline and about $22 above the lower band, so it is not stretched on this measure. The midline near $286.5 is resistance. [Bearish]
- CMF (20): -0.073, below the -0.05 threshold. It has stayed mildly negative (-0.06 to -0.12) throughout the bounce, so sellers are still active. [Distribution]
- ADX (14): 49.6, very strong but falling from a peak of 56.2. −DI (38.7) is well above +DI (20.3), though +DI has risen from about 9 and −DI has dropped from 56. The downtrend is intact but losing intensity. [Strong Trend – Bearish]
- Volume: 2.5K on the latest bar, very light compared with the heavy-volume gap-down selloff. Volume has dried up during the sideways consolidation, which is typical of a pause or flag after a sharp drop, not a confirmed reversal. [Neutral / Consolidation]
DIVERGENCES & TRENDS
- Price made lower lows into Oct 30 (277.80) while RSI bottomed earlier at 16.4 and has since held higher, a mild momentum improvement. It is not a confirmed bullish divergence.
- The MACD bullish crossover came from deeply negative territory and has no follow-through yet, as price keeps failing near $284-286.
- Price is below the SMA50D ($337.82) and SMA200D ($340.40). The SMA50D is below the SMA200D (death cross), and both are rolling lower, so the long-term trend is bearish.
- Price is below VWAP ($284.34) and EMA13 ($284.46), which cluster as one resistance zone.
- ADX is rolling over from its peak while −DI remains dominant. The downtrend is maturing, but no DI crossover has occurred.
CHART PATTERNS
- The chart shows a bearish flag / pennant-type consolidation after a near-vertical gap-down from about $320 to $283. Price is moving sideways in a tight $278-$286 range on declining volume.
- A break below the $277.80 consolidation low would project a measured move toward the low $270s and then toward the lower Bollinger Band area (about $260), per the Bearish Flag/Pennant pattern in the reference diagram.
- The bullish alternative is a base or double bottom, but it needs a close above $285.68 and above VWAP/EMA13, and that has not happened.
POTENTIAL SCENARIOS
- Scenario 1: Bearish Flag Breakdown — Price keeps being rejected at the EMA13/VWAP cluster and breaks the consolidation low, with −DI still dominant and CMF negative. Trigger: hourly close below $277.80. Target: $270-$273. Invalidation: close above $286.55 (the Bollinger midline). (50% probability)
- Scenario 2: Bullish Relief Rally — The MACD crossover and oversold RSI bounce carry price through the EMA13/VWAP cluster for a mean-reversion move. Trigger: close above $285.68 on rising volume. Target: $291-$295. Invalidation: loss of $278. (33% probability)
- Scenario 3: Neutral Range Chop — Price stays in the $278-$286 range with fading ADX and low volume. Trigger: repeated tests of both edges without a close outside. Target: about $282. Invalidation: a close outside the $277.80-$285.70 range. (17% probability)
PRICE TARGETS
- Target Price: $277.50 (5-day). This is about 1.7% below current, a continuation of the downtrend toward the consolidation low and slightly below it.
- Expected Range: $270.00 to $288.00. The width is $18, about 6.4% of current price, which fits the 7-10 day band scaled down for 5 days.
- Key Levels: Support at $277.80 (recent swing low); resistance at $285.68 (recent bounce high, with EMA13/VWAP just below at about $284.4).
OVERALL BIAS
OVERALL BIAS: BEARISH - Price is below all key moving averages and VWAP, −DI dominates a very strong ADX, CMF shows distribution, and the bounce is stalling at the EMA13/VWAP resistance cluster in a bear-flag-type consolidation. The MACD crossover and RSI bounce from oversold keep conviction modest and leave a relief-rally risk above $285.70.
This is educational analysis and not financial advice.