SMH 5-day bearish forecast — Nov 2, 2026
- Bias: Bearish
- Timeframe: 5 days (made Nov 2, 2026, target date Nov 6, 2026)
- Price at analysis: $520.87
- Price target: $511.50
- Expected range: $496.50 – $535.50
- Result: Correct (-10.5%) — closed at $466.00 on Nov 6, 2026; quality score 50/100
Get a free AI analysis of SMH today
Analysis
TECHNICAL INDICATORS
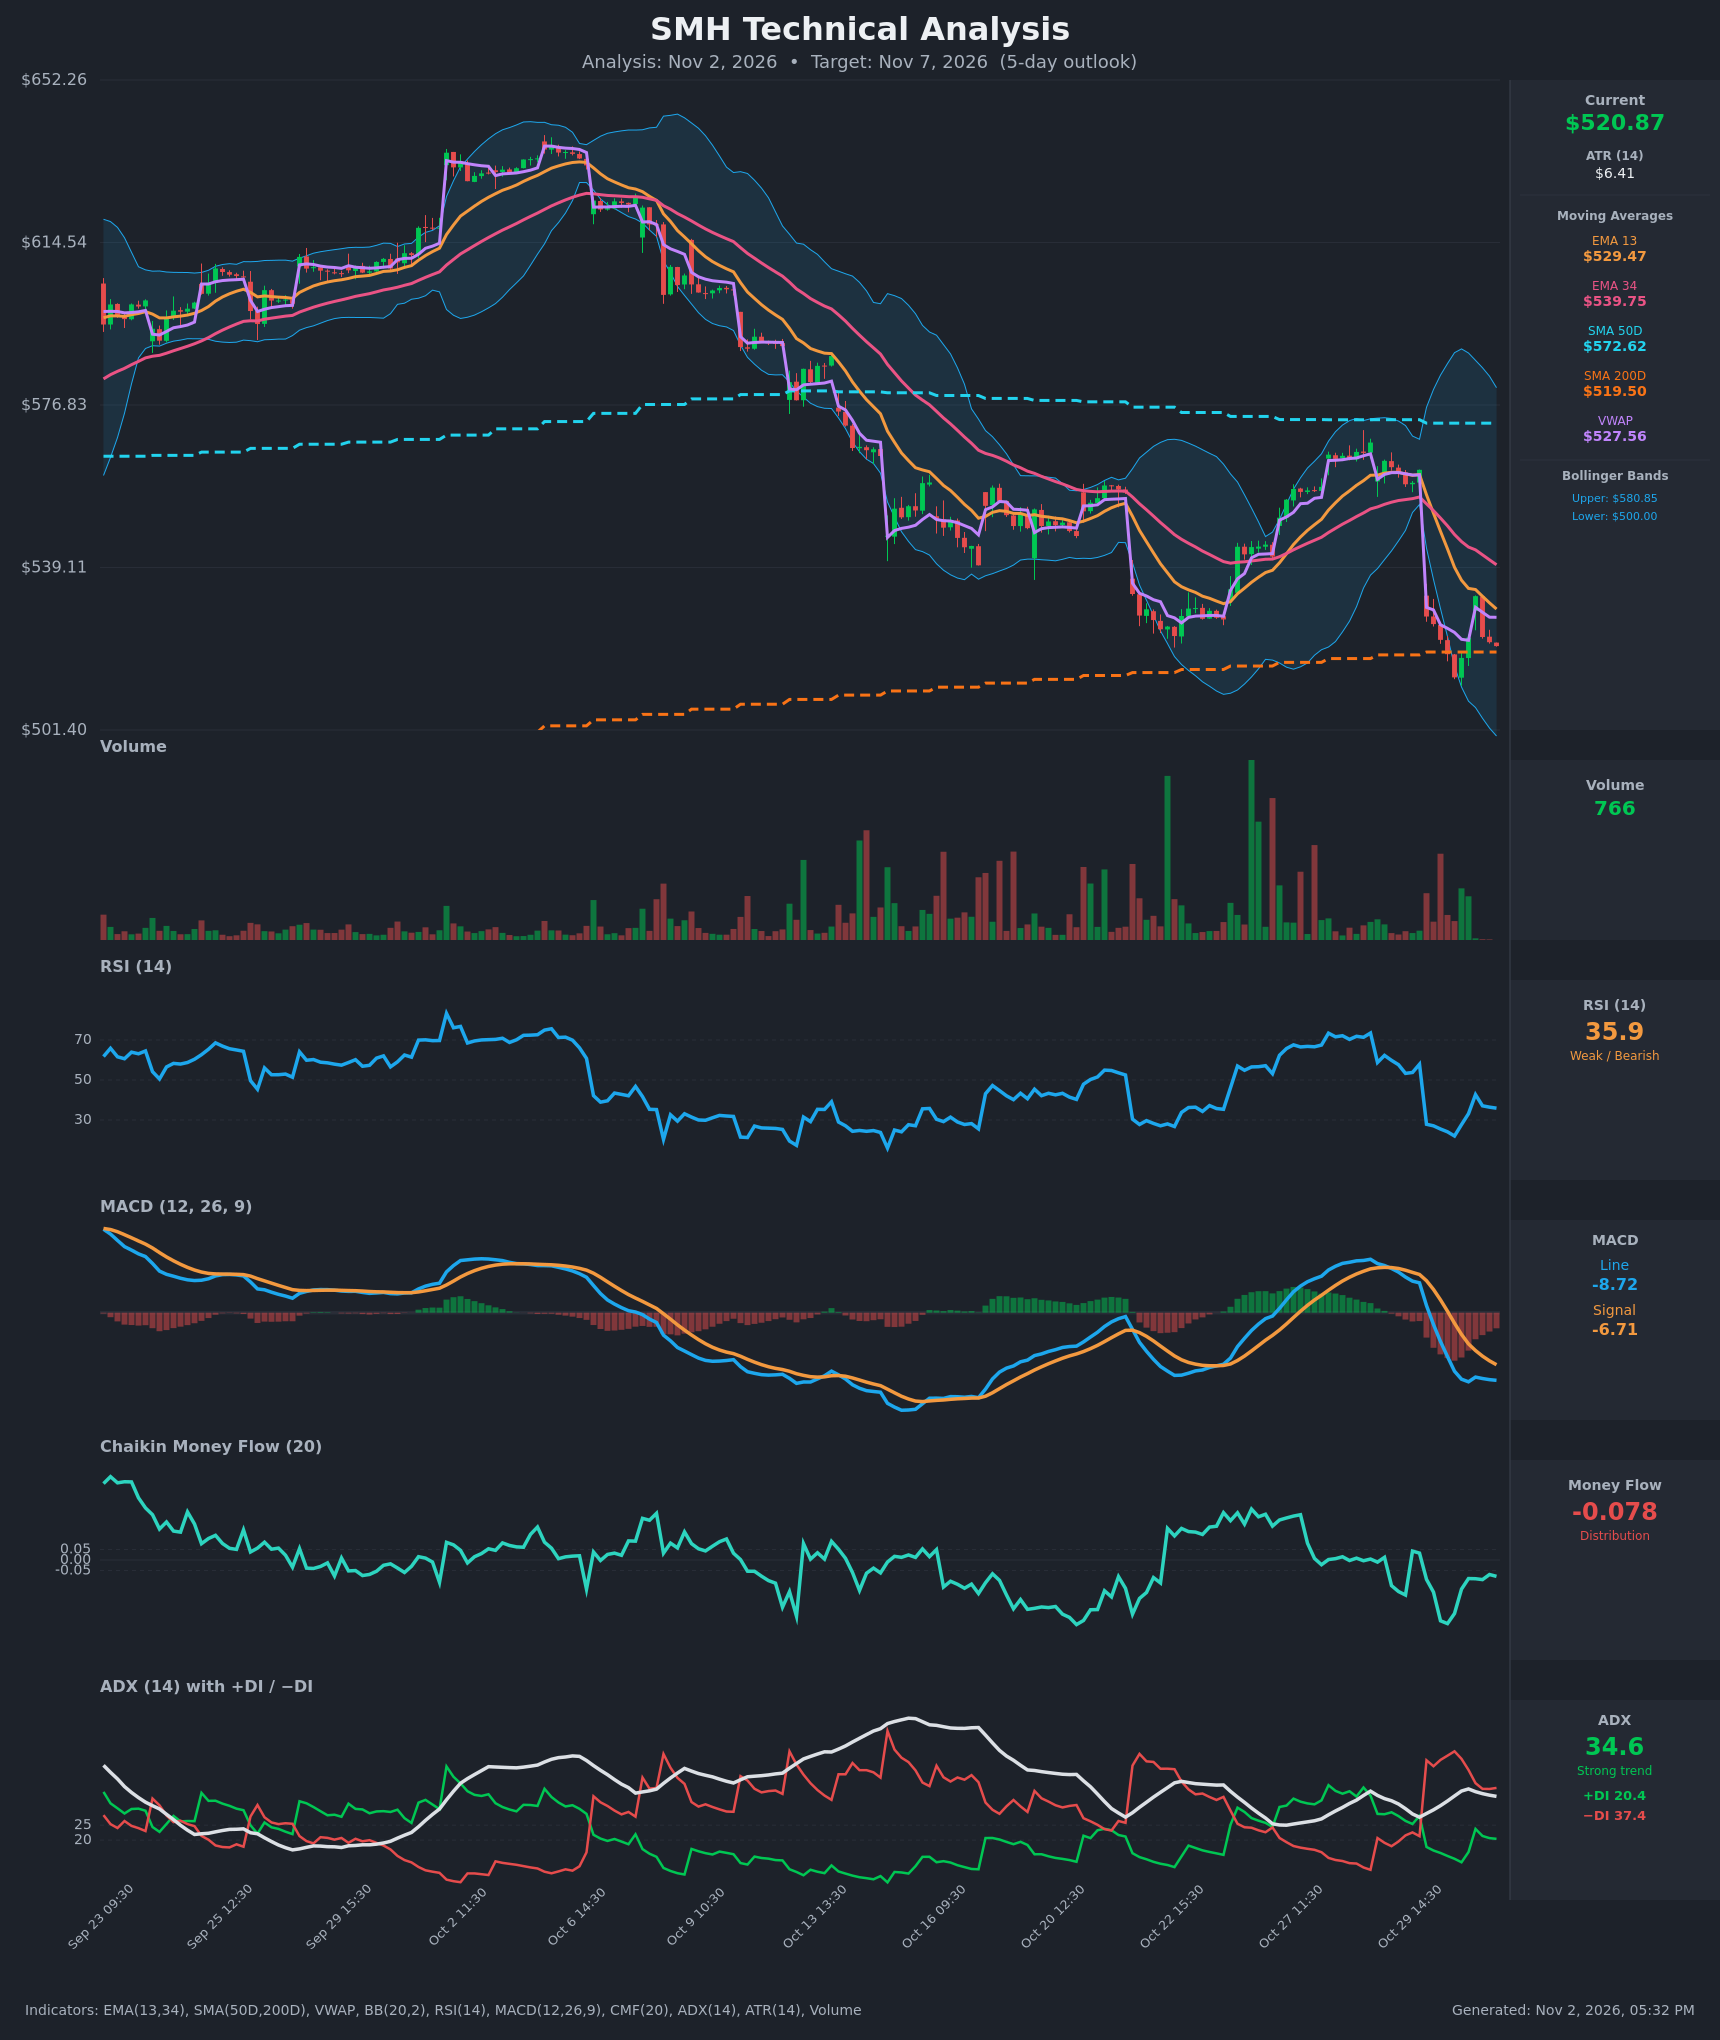
- RSI (14): 35.91, weak and near oversold but not below 30. It bottomed at 22.0 on Oct 30 and bounced to 42.7 on Nov 2 before rolling over again. Momentum is fading on the bounce. [Bearish]
- 20 EMA: The chart shows EMA 13/34 instead. EMA13 is $529.47 and EMA34 is $539.75, and price at $520.87 is below both. EMA13 crossed below EMA34 around Oct 30 10:00-11:00, and both are sloping down, so they act as overhead resistance. [Bearish]
- MACD: The line is -8.72, below the signal at -6.71, after a bearish crossover on Oct 30. The histogram is about -2.0, much smaller than the roughly -6 of Oct 30 afternoon, so downside momentum is decaying. The line is still making marginally new lows. [Bearish]
- Bollinger Bands (20): Upper is $580.85 and lower is $500.00. Price sits in the lower third of a wide band, about $21 above the lower band. The bands are wide after the gap-down, so volatility is elevated. Price has been "walking" the lower half, and the band midpoint (about $540) is well above. [Bearish]
- CMF (20): -0.078, below the -0.05 threshold. It has been mostly negative since Oct 29 and has not recovered even during the bounce, which means sustained selling pressure. [Distribution]
- ADX (14): 34.6, a strong trend, though it is easing from 37.1. −DI is 37.4 against +DI at 20.4, so the bears are clearly in control. [Strong Trend – Bearish]
- Volume: 766 on the latest bar, which is very light and mostly in line with quiet bars. The heavy volume came on the Oct 30 gap-down selling, with only moderate buying on the bounce. Low-volume drift near support is consistent with a pause or bear flag rather than capitulation. [Neutral to Mildly Bearish]
Other levels:
- VWAP: $527.56, above price, so sellers hold the intraday edge.
- SMA200D: $519.50, just under price. It is the key long-term support, and price is sitting on it.
- SMA50D: $572.62, well above price and falling.
- Death cross: not present, because SMA50D is far above SMA200D, but the gap is narrowing.
DIVERGENCES & TRENDS
- There is no clear bullish divergence. The RSI of 35.9 near $521 is similar to the 33.1 at $522.83 on Oct 30 15:30, so momentum is not improving relative to price.
- The only positive sign is that the MACD histogram is contracting, which suggests selling momentum is slowing.
- The Nov 2 bounce to $532.46 was rejected below EMA13 and VWAP, and price has since drifted back down toward $520. Lower highs are forming inside the post-gap structure.
- The Oct 30 gap-down from about $562 to $528 broke the uptrend that started Oct 22 and took out both EMAs.
- The longer trend shows lower highs from about $640 (early Oct) to about $570 (Oct 28). It is still a downtrend with SMA50D as a ceiling.
- −DI dominance with ADX above 30 supports continuation lower, although ADX is starting to flatten.
- Price is testing SMA200D at $519.50 and has not yet closed decisively below it. A loss of this level is the key break to watch.
CHART PATTERNS
- Bearish Flag / Pennant (continuation): After the sharp gap-down (the flagpole of about $35), price has formed a small, low-volume, slightly rising consolidation between about $513 and $532. A downside break measures to roughly $497-$500, which matches the lower Bollinger Band.
- Descending structure / lower highs (Bearish Descending Triangle flavor): The repeated tests of the $513-$520 area (SMA200D) against falling resistance at EMA13 and VWAP resemble a descending triangle. A confirmed break below $513 would favor continuation.
- Counter-pattern risk: A possible double bottom at $513-$514 (Oct 30 low and the Nov 2 area) would be bullish if price clears $532.50. That has not happened yet.
POTENTIAL SCENARIOS
- Scenario 1: Bearish Flag Breakdown Through SMA200D — Price fails at EMA13/VWAP resistance and loses the SMA200D, then the $513 low. Distribution (CMF) and −DI dominance drive continuation toward the lower Bollinger Band. Trigger: hourly close below $513.50 on rising volume. Target: $500-$505, with an extension to about $497. Invalidation: close above $532.50 (the Nov 2 high and above EMA13/VWAP). (50% probability)
- Scenario 2: Bullish Oversold Bounce Off SMA200D — Price holds the 200-day, RSI turns up from the mid-30s, and the shrinking MACD histogram leads to a mean-reversion bounce toward EMA34. Trigger: hourly close above $529.50 (EMA13) and VWAP, with CMF back above 0. Target: $539-$541 (EMA34). Invalidation: close below $513. (28% probability)
- Scenario 3: Neutral Chop Around the 200-Day — Price oscillates between $513 and $532 with fading ADX as the market digests the gap. Trigger: failure to break either $513 or $532 within the 5-day window. Target: $518-$526. Invalidation: decisive break of either boundary. (22% probability)
PRICE TARGETS
Timeframe is 5 days, so the range width should be about 4-8% of price. A $39 range is about 7.5% of $520.87, which is consistent with that band and with the ATR (about 6.4 per hourly bar, with elevated volatility).
- Target Price: $511.50 (5 days from now)
- Expected Range: $496.50 to $535.50 (width $39, about 7.5%)
- Key Levels: Support at $519.50 (SMA200D), with deeper support at about $500 (lower Bollinger Band); Resistance at $529.47 (EMA13), with further resistance at about $532.50 (Nov 2 high)
OVERALL BIAS
OVERALL BIAS: BEARISH - Price is below both EMAs and VWAP with a bearish MACD cross, −DI far above +DI at ADX 34.6, and CMF in distribution. The bounce off the Oct 30 low is stalling under resistance in a bear-flag structure. The RSI is near oversold and the 200-day is directly underneath, so conviction is modest, but a loss of $513 would open the path to about $500.
This is educational analysis and not financial advice.