SPY 2-day bearish forecast — Nov 2, 2026
- Bias: Bearish
- Timeframe: 2 days (made Nov 2, 2026, target date Nov 3, 2026)
- Price at analysis: $752.14
- Price target: $750.80
- Expected range: $747.90 – $754.60
- Result: Correct (-0.1%) — closed at $751.24 on Nov 3, 2026; quality score 100/100
Get a free AI analysis of SPY today
Analysis
TECHNICAL INDICATORS
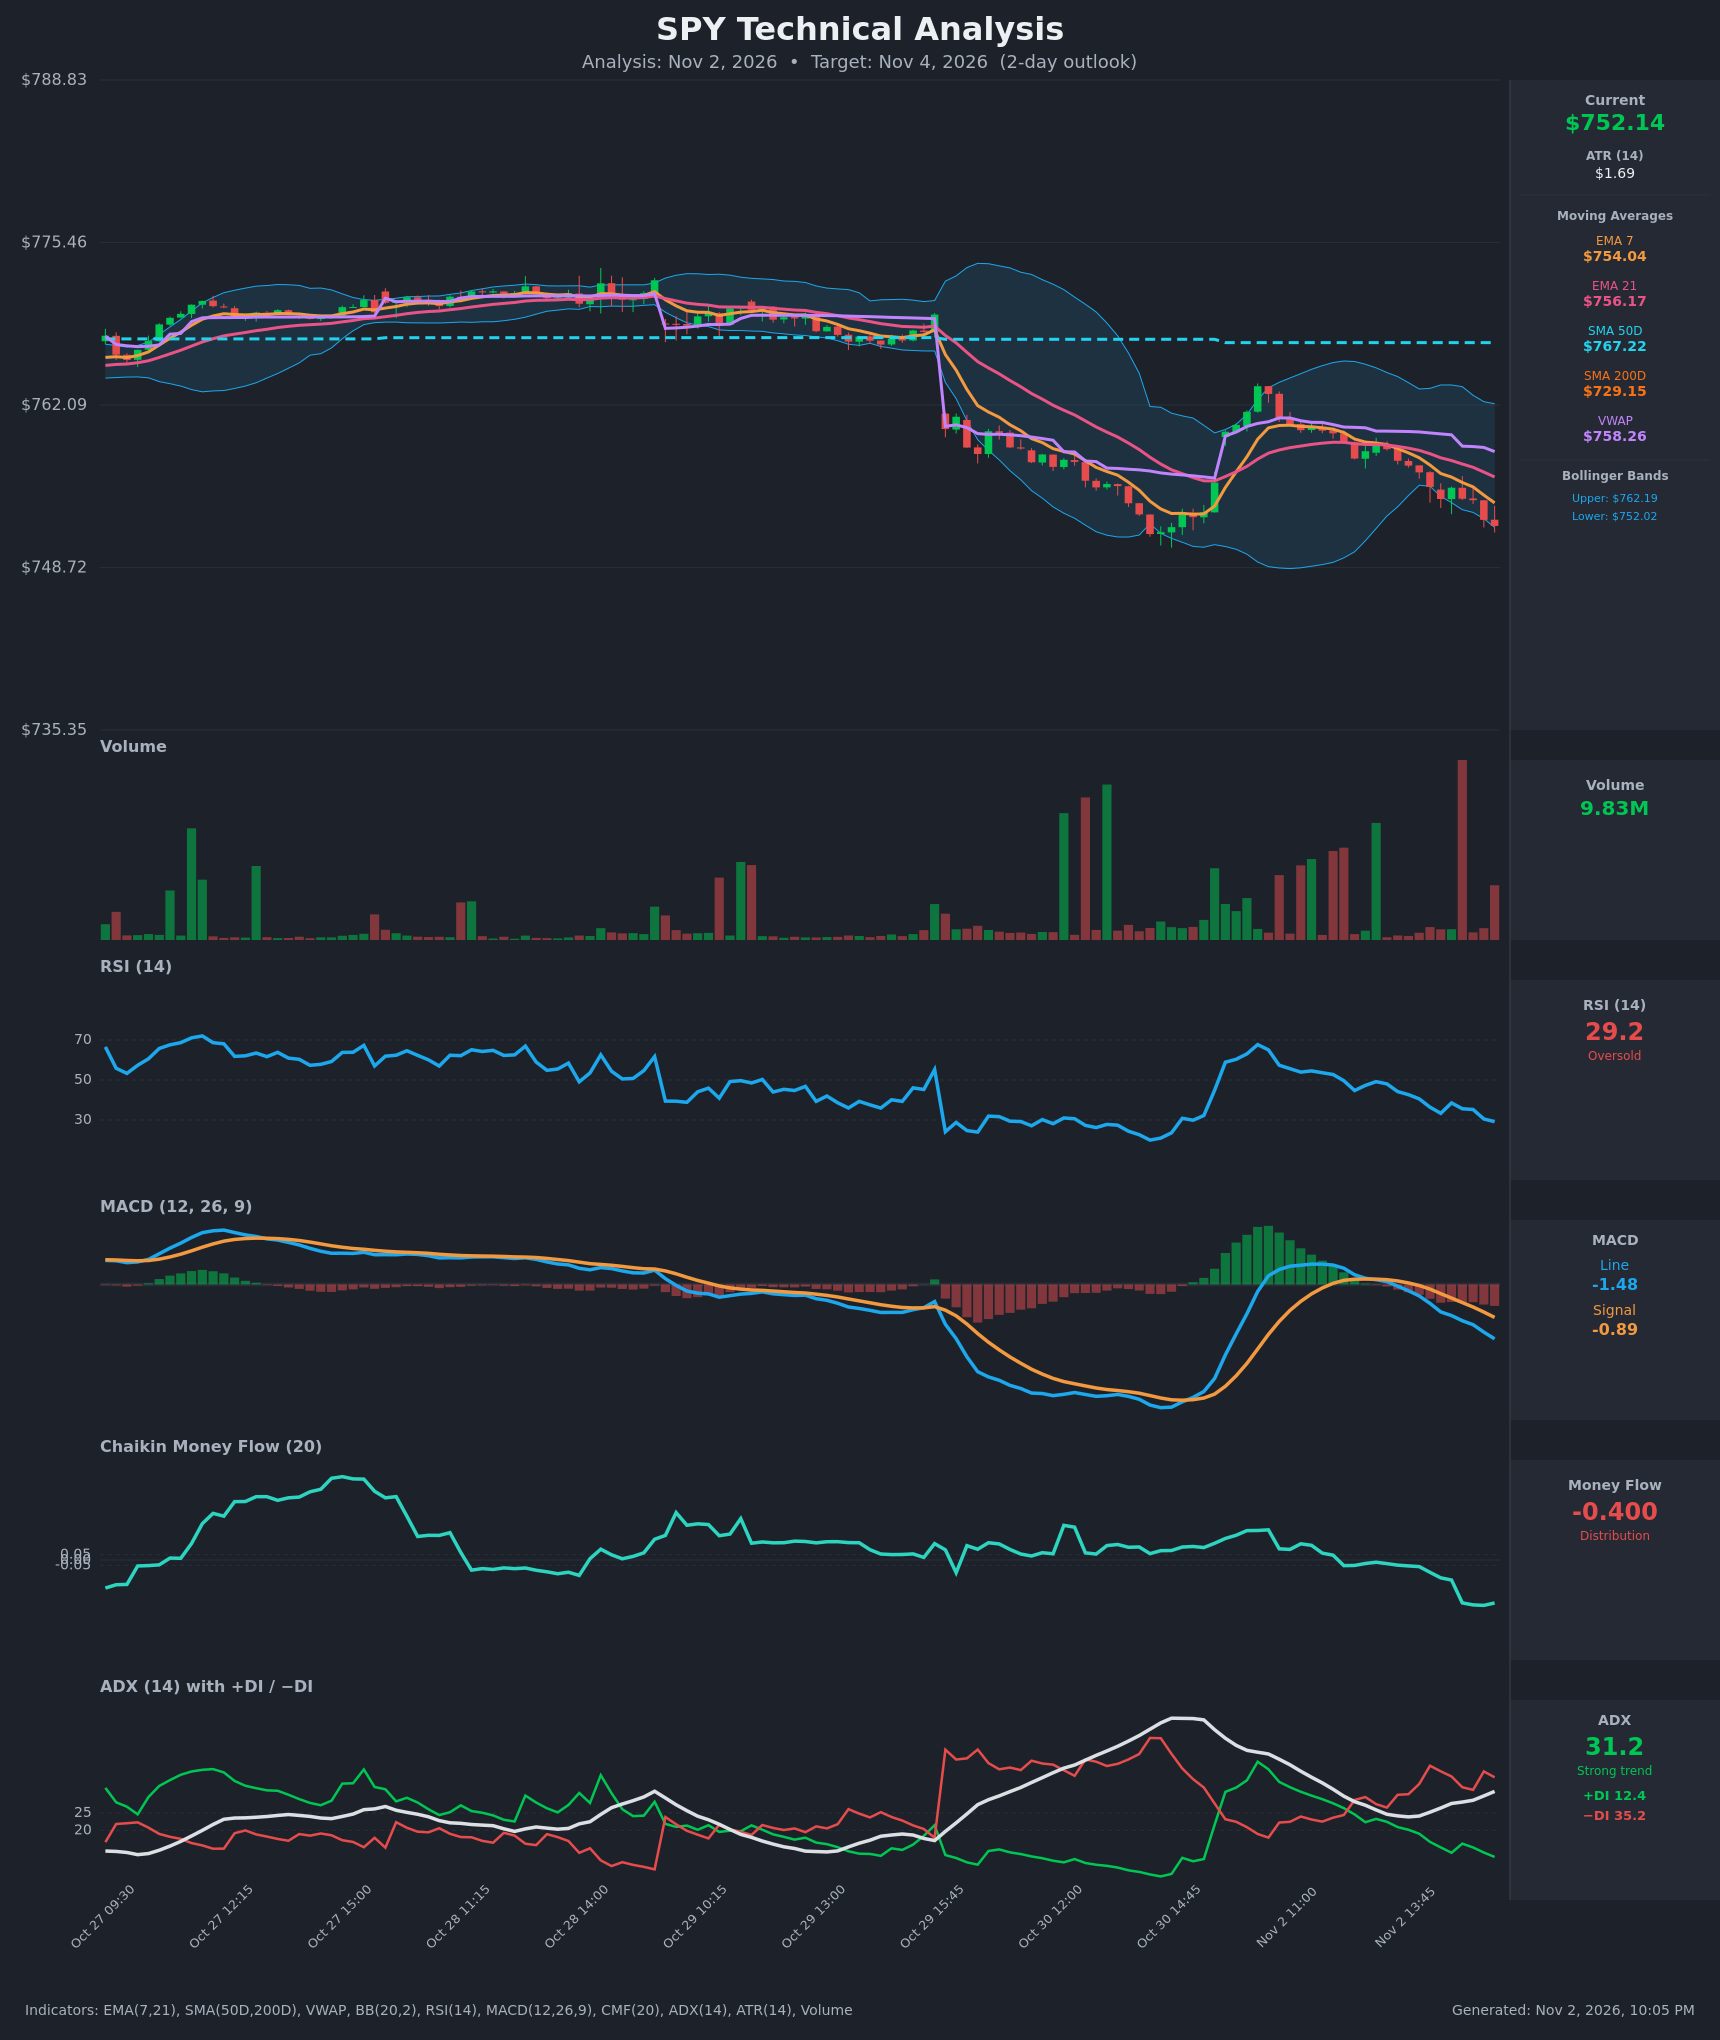
- RSI (14): 29.20, in oversold territory and falling steadily from about 49 earlier in the session. Momentum is clearly down, with no bullish divergence yet. Oversold readings in a strong downtrend can stay oversold. [Bearish]
- 20 EMA (EMA 7 / EMA 21 used): EMA 7 is $754.04 and EMA 21 is $756.17. Price at $752.14 is below both, and EMA 7 is below EMA 21, so a bearish crossover is already in place. Both averages are sloping down and act as overhead resistance. [Bearish]
- MACD: The line is -1.477 and the signal is -0.894. The line crossed below the signal around 13:30 and the gap is widening. The histogram is negative and expanding, about -0.58. [Bearish]
- Bollinger Bands (20): The upper band is $762.19 and the lower band is $752.02. Price at $752.14 sits right on the lower band, so it is walking the band. That is a sign of trend strength, though it is also stretched for a short-term bounce. [Bearish]
- CMF (20): -0.400, well below -0.05 and near its recent low. This is heavy distribution, with selling pressure sustained and increasing. [Distribution]
- ADX (14): 31.2 and rising, above 25, so the trend is strong. −DI at 35.2 is far above +DI at 12.4, so bears are firmly in control. [Strong Trend – Bearish]
- Volume: 9.83M on the latest bar, with several heavy red bars in the recent decline, including a very large red spike near the end of the chart. Volume is expanding on down moves, which confirms selling. It could also hint at capitulation. [Bearish – selling pressure confirmed]
DIVERGENCES & TRENDS
- No bullish divergence has formed. RSI is making new lows along with price, and MACD and CMF are also at fresh lows.
- Price is below VWAP ($758.26), EMA 7 and EMA 21, and below SMA50D ($767.22). It remains above SMA200D ($729.15), so the long-term trend is intact but weakening. The SMA50 is still above the SMA200, so there is no death cross.
- The MACD bearish crossover and the −DI dominance are fresh and strengthening.
- Price is below the 4-bar-old low of the bounce (~$754), and the low from Oct 30 (~$750) is the next structural reference.
- A pullback from the recent high of ~$765 (the Oct 30 bounce) made a lower high. The sequence of lower highs and lower lows is a bearish structure.
CHART PATTERNS
- The structure resembles a Bearish Flag / Descending channel after the sharp Oct 29 drop. Price bounced on Oct 30–31 to ~$763, then rolled over in a lower-high sequence and is stepping down.
- It also looks like a Bearish Pennant / Rising Wedge continuation, with a lower high at ~$763 versus the earlier ~$773 plateau.
- The measured move from the flag points toward the Oct 30 low of ~$750 and possibly the $748 area.
- Over a 2-day window, the oversold RSI and the lower Bollinger Band suggest a possible relief bounce toward EMA 7 and EMA 21 before more downside.
POTENTIAL SCENARIOS
- Scenario 1: Bearish Trend Continuation — Sellers stay in control with −DI dominant and MACD widening, and price breaks the lower band and the Oct 30 low area. Trigger: a break below $751.50 on volume. Target: $749.00–$750.00. Invalidation: a reclaim of EMA 21 near $756. (50% probability)
- Scenario 2: Neutral/Bullish Oversold Relief Bounce — RSI at 29 and price on the lower band bring a mean-reversion bounce toward EMA 7/EMA 21. Trigger: a hold above $751.5 and a close above $754. Target: $755.00–$756.50. Invalidation: a break below $750.50. (35% probability)
- Scenario 3: Neutral Sideways Chop — Price consolidates near the lower band as momentum stalls. Trigger: low-volume range trade. Target: $751.00–$753.50. Invalidation: a decisive break either side. (15% probability)
PRICE TARGETS
- Target Price: $750.80 (2-day horizon)
- Expected Range: $747.90 to $754.60 (width $6.70, about 0.9% of current price; ATR-based, tightened for 2 days)
- Key Levels: Support at $750.00, Resistance at $754.04
Self-check: the 2-day range is about 0.9% of current price. This is narrower than the 2–4% guidance, but it is consistent with the ATR of $1.69, which implies roughly $4–5 of typical 2-day movement. It is wider than any 1-day range would be.
OVERALL BIAS
OVERALL BIAS: BEARISH - Price is below all short-term moving averages and VWAP, with a MACD bearish crossover, ADX of 31 and rising, −DI far above +DI, CMF at -0.40, and heavy volume on the declines. The oversold RSI raises the risk of a bounce, but the trend evidence favors further downside over the next 2 days.
This is educational analysis and not financial advice.