AAPL 18-day bearish forecast — Nov 3, 2026
- Bias: Bearish
- Timeframe: 18 days (made Nov 3, 2026, target date Nov 20, 2026)
- Price at analysis: $338.32
- Price target: $333.50
- Expected range: $320.50 – $352.50
- Result: Pending — graded after the close on Nov 20, 2026
Get a free AI analysis of AAPL today
Analysis
TECHNICAL INDICATORS
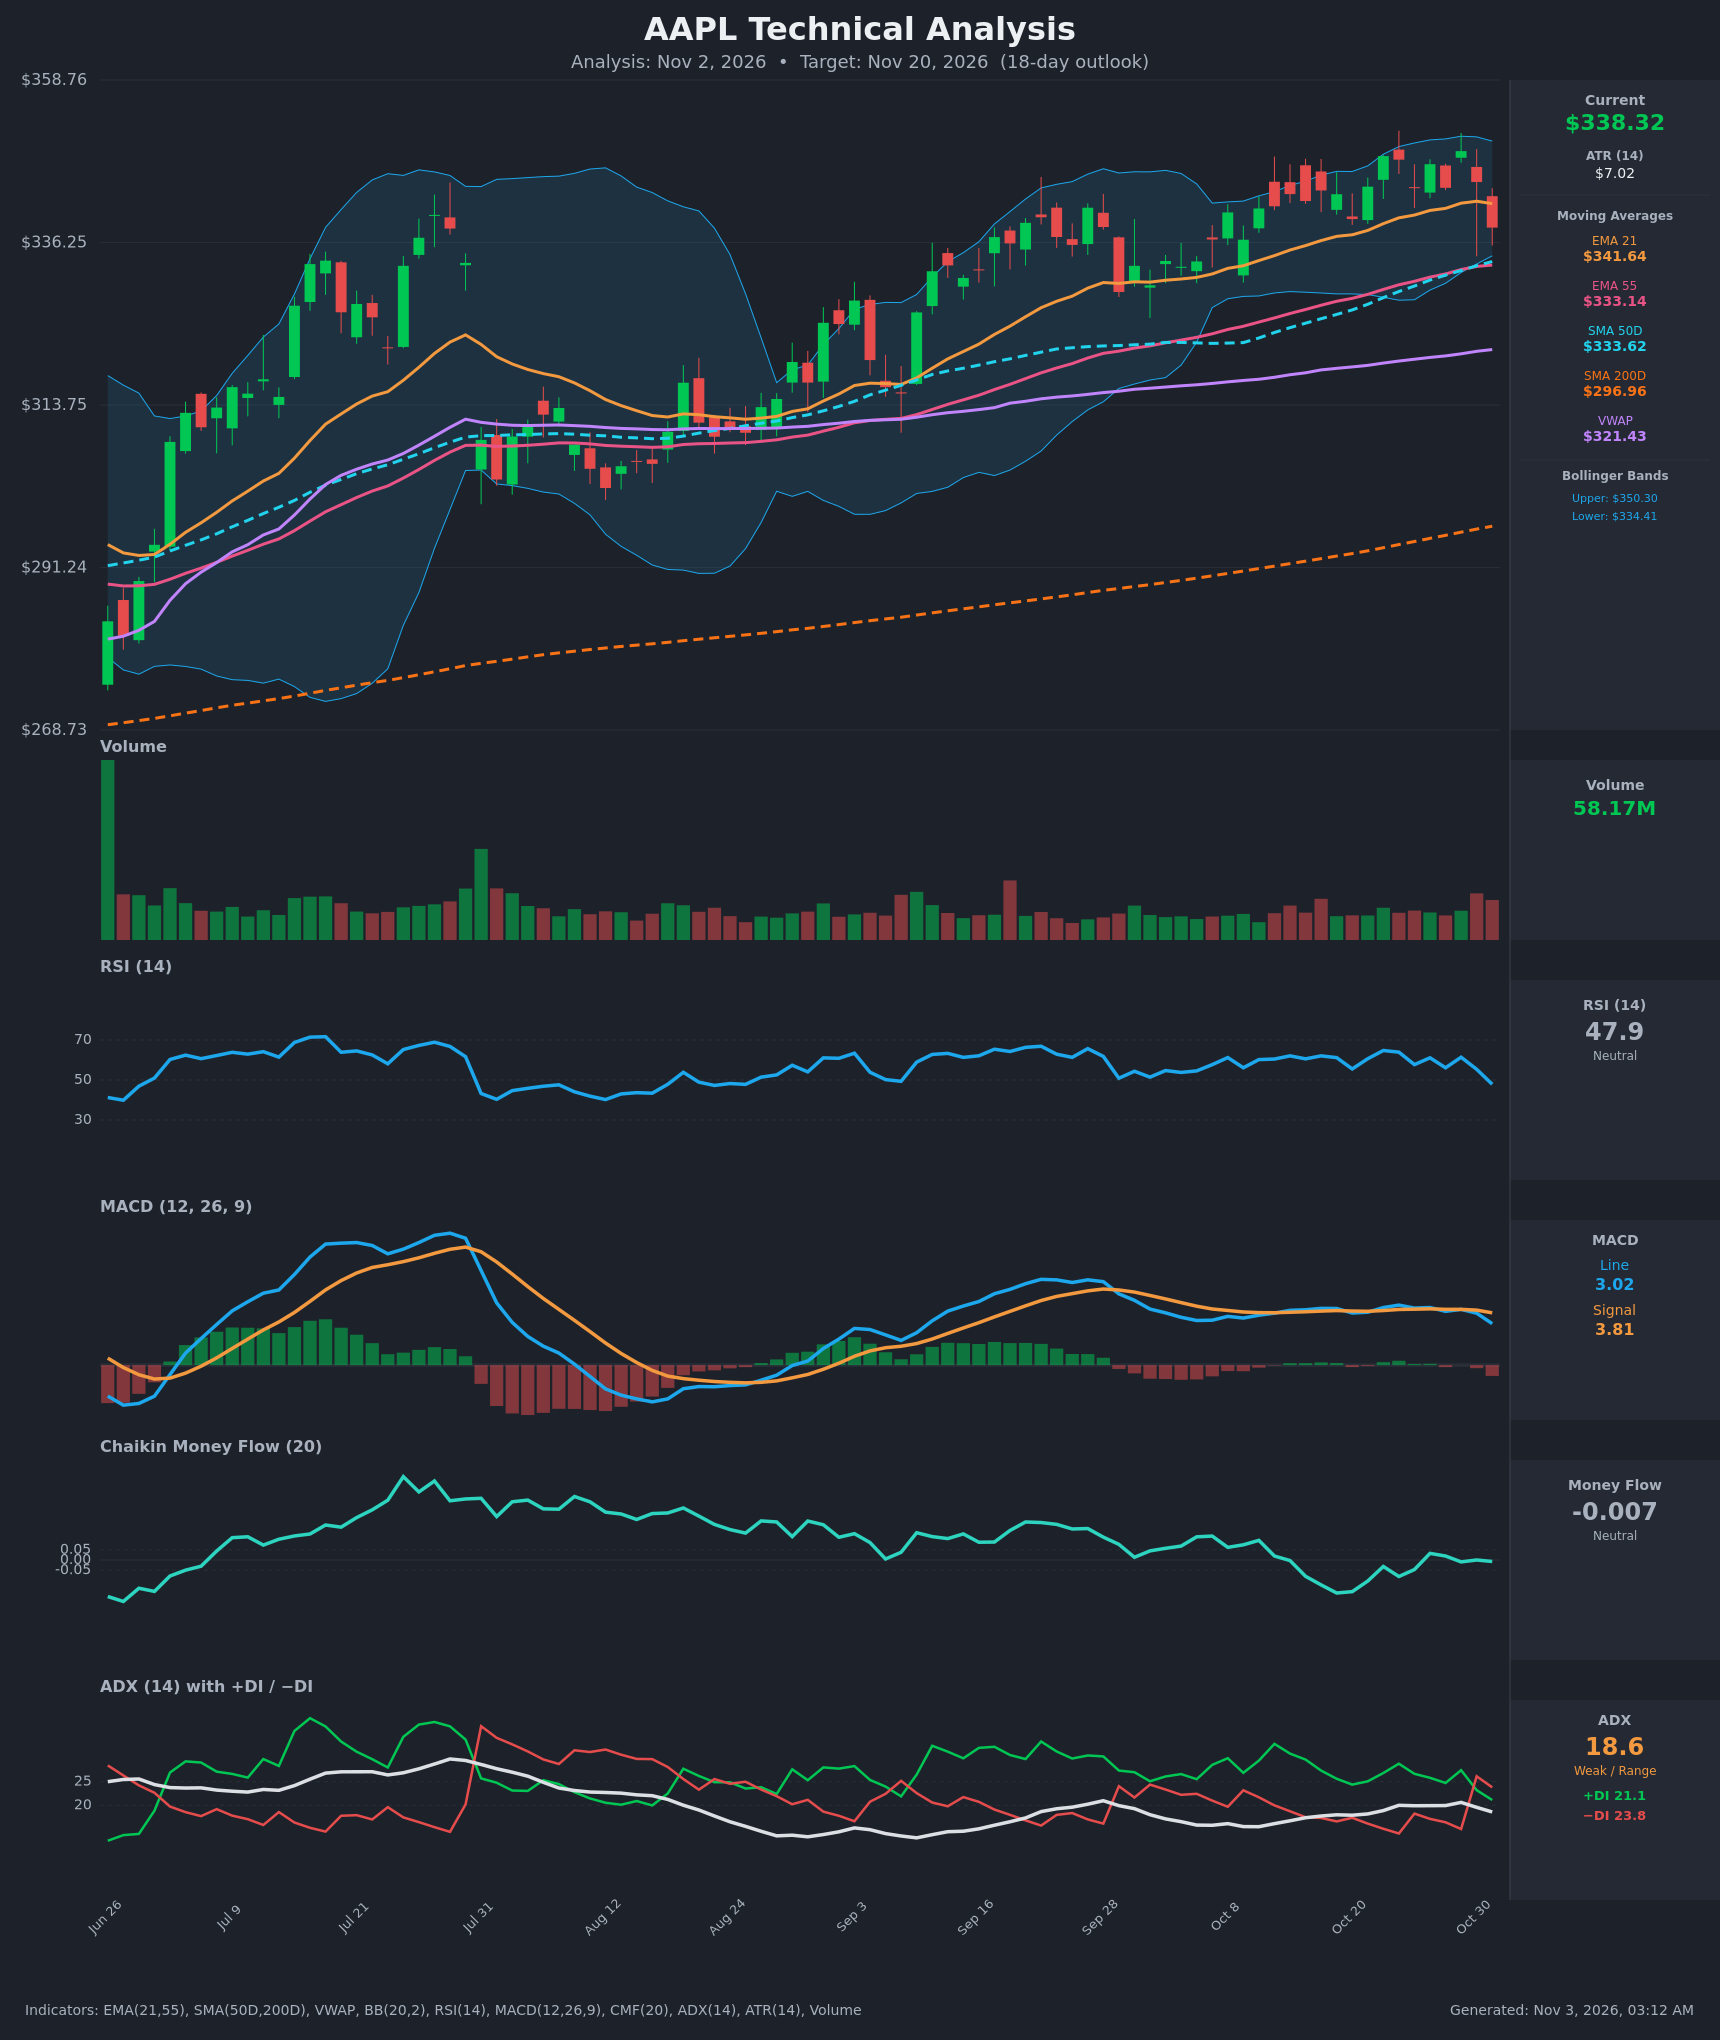
- RSI (14): 47.87, down from 61.4 on Oct 29 and 55.3 on Oct 30. It has dropped below the 50 midline and is still falling, so short-term momentum has turned negative. It is not oversold. [Bearish]
- 20 EMA (EMA 21): $341.64, with price at $338.32 below it. The EMA21 is still sloping up, but the first close below it since mid-October makes it near-term resistance. EMA21 is above EMA55 ($333.14), so the intermediate trend is intact. [Bearish]
- MACD: Line 3.02 is below Signal 3.81, with a histogram of about -0.79. The line crossed below the signal on Oct 29-30 and the gap is widening. Both lines are still positive but flattening and rolling over. [Bearish]
- Bollinger Bands (20): Upper $350.30, lower $334.41, so the bands are narrow, which signals low volatility. Price at $338.32 sits in the lower quarter of the band, down from the upper band tests of Oct 22-29. A close below $334.41 would be a downside band break. [Neutral]
- CMF (20): -0.007, inside the ±0.05 neutral zone. It has hovered around zero after dipping to -0.16 on Oct 19, so there is no clear accumulation or distribution. [Neutral]
- ADX (14): 18.6, which is weak and range-bound territory. −DI (23.8) crossed above +DI (21.1) on Oct 30, a small bearish DI crossover. The gap is thin, so the trend is not strong. [Weak Trend, bearish tilt]
- Volume: 58.17M on a red candle, above the recent average, which makes this a distribution-type down day. Volume has been mostly muted during the October grind higher, so the rally lacked strong participation. [Mildly Bearish]
Moving-average structure remains constructive. SMA50D ($333.62) is well above SMA200D ($296.96), so the golden cross is long established, and price is above SMA200D and VWAP ($321.43).
DIVERGENCES & TRENDS
- Price made a marginally higher high at $348.91 on Oct 29 versus $348.22 on Oct 22, while RSI peaked lower (61.4 versus 64.8) and MACD (4.06 versus 4.37) also peaked lower. This is a mild bearish divergence.
- The MACD bearish crossover (Oct 29-30) and the −DI over +DI crossover (Oct 30) both came together with a drop through EMA21. This is a momentum shift.
- The longer-term trend is still up. EMA21 > EMA55 > SMA50D > SMA200D, and the medium-term MAs are rising.
- ADX below 20 shows the October advance was a slow grind, not a high-conviction trend. That makes a pullback or sideways digestion more likely than a sharp collapse.
- Support is stacked just below price: BB lower at $334.41, SMA50D at $333.62 and EMA55 at $333.14.
CHART PATTERNS
- Bearish Double Top (reversal): Highs at $348.22 (Oct 22) and $348.91 (Oct 29) with a neckline near $339.50 (Oct 20 close). Price closed at $338.32, just through the neckline. The measured move is about $9.5 (high of $349 minus neckline of $339.5), which gives roughly $330. The pattern is only marginally confirmed, and the $333–334 MA cluster should slow the decline.
- Rising channel / mild Rising Wedge tendency: The September–October advance has narrowing, overlapping swings below the upper Bollinger Band. A break of the lower trend support (the $333–334 area) would strengthen the bearish case.
- Broader context: The multi-month uptrend from the June lows is intact. The setup is more likely a corrective pullback inside an uptrend than a full reversal.
POTENTIAL SCENARIOS
- Scenario 1: Bearish Pullback to the Moving-Average Cluster — The double-top breakdown, MACD and DI bearish crossovers and the EMA21 rejection push price down to test SMA50D/EMA55. Trigger: a daily close below $334.41 (BB lower) on rising volume. Target: $333 first, then an extension to $328–330 (double-top measured move). Invalidation: a daily close back above $341.64 (EMA21) with RSI back above 55. (50% probability)
- Scenario 2: Bullish Bounce Off Support — Buyers defend the $333–334 confluence and the long-term uptrend resumes, as in prior pullbacks. Trigger: a bounce from $333–334 with a reclaim of EMA21 at $341.64. Target: $348–350 (prior highs and upper Bollinger Band). Invalidation: a daily close below $333 (SMA50D/EMA55). (30% probability)
- Scenario 3: Neutral Range-Bound Chop — Weak ADX and a narrow Bollinger Band hold price between the MA cluster and the prior highs. Trigger: failure to close beyond either $333 or $344. Target: $334–344 range. Invalidation: a decisive close outside $333 or $349. (20% probability)
PRICE TARGETS
For 18 days (Nov 20, 2026):
- Target Price: $333.50
- Expected Range: $320.50 to $352.50 (width $32.00, about 9.5% of the current price, consistent with the 14–21 day guidance)
- Key Levels: Support at $333.14 (EMA55/SMA50D zone), Resistance at $341.64 (EMA21)
OVERALL BIAS
OVERALL BIAS: BEARISH - Price has broken below EMA21, with a bearish MACD crossover, −DI above +DI, RSI rolling under 50 and a marginal double-top neckline break on heavier volume. Support from the rising SMA50D/EMA55 cluster near $333 and the long-term uptrend should limit the downside, so the expected move is a modest pullback.
This is educational analysis and not financial advice.