DELL 45-day bearish forecast — Nov 3, 2026
- Bias: Bearish
- Timeframe: 45 days (made Nov 3, 2026, target date Dec 18, 2026)
- Price at analysis: $410.86
- Price target: $385.00
- Expected range: $330.00 – $462.00
- Result: Pending — graded after the close on Dec 18, 2026
Get a free AI analysis of DELL today
Analysis
TECHNICAL INDICATORS
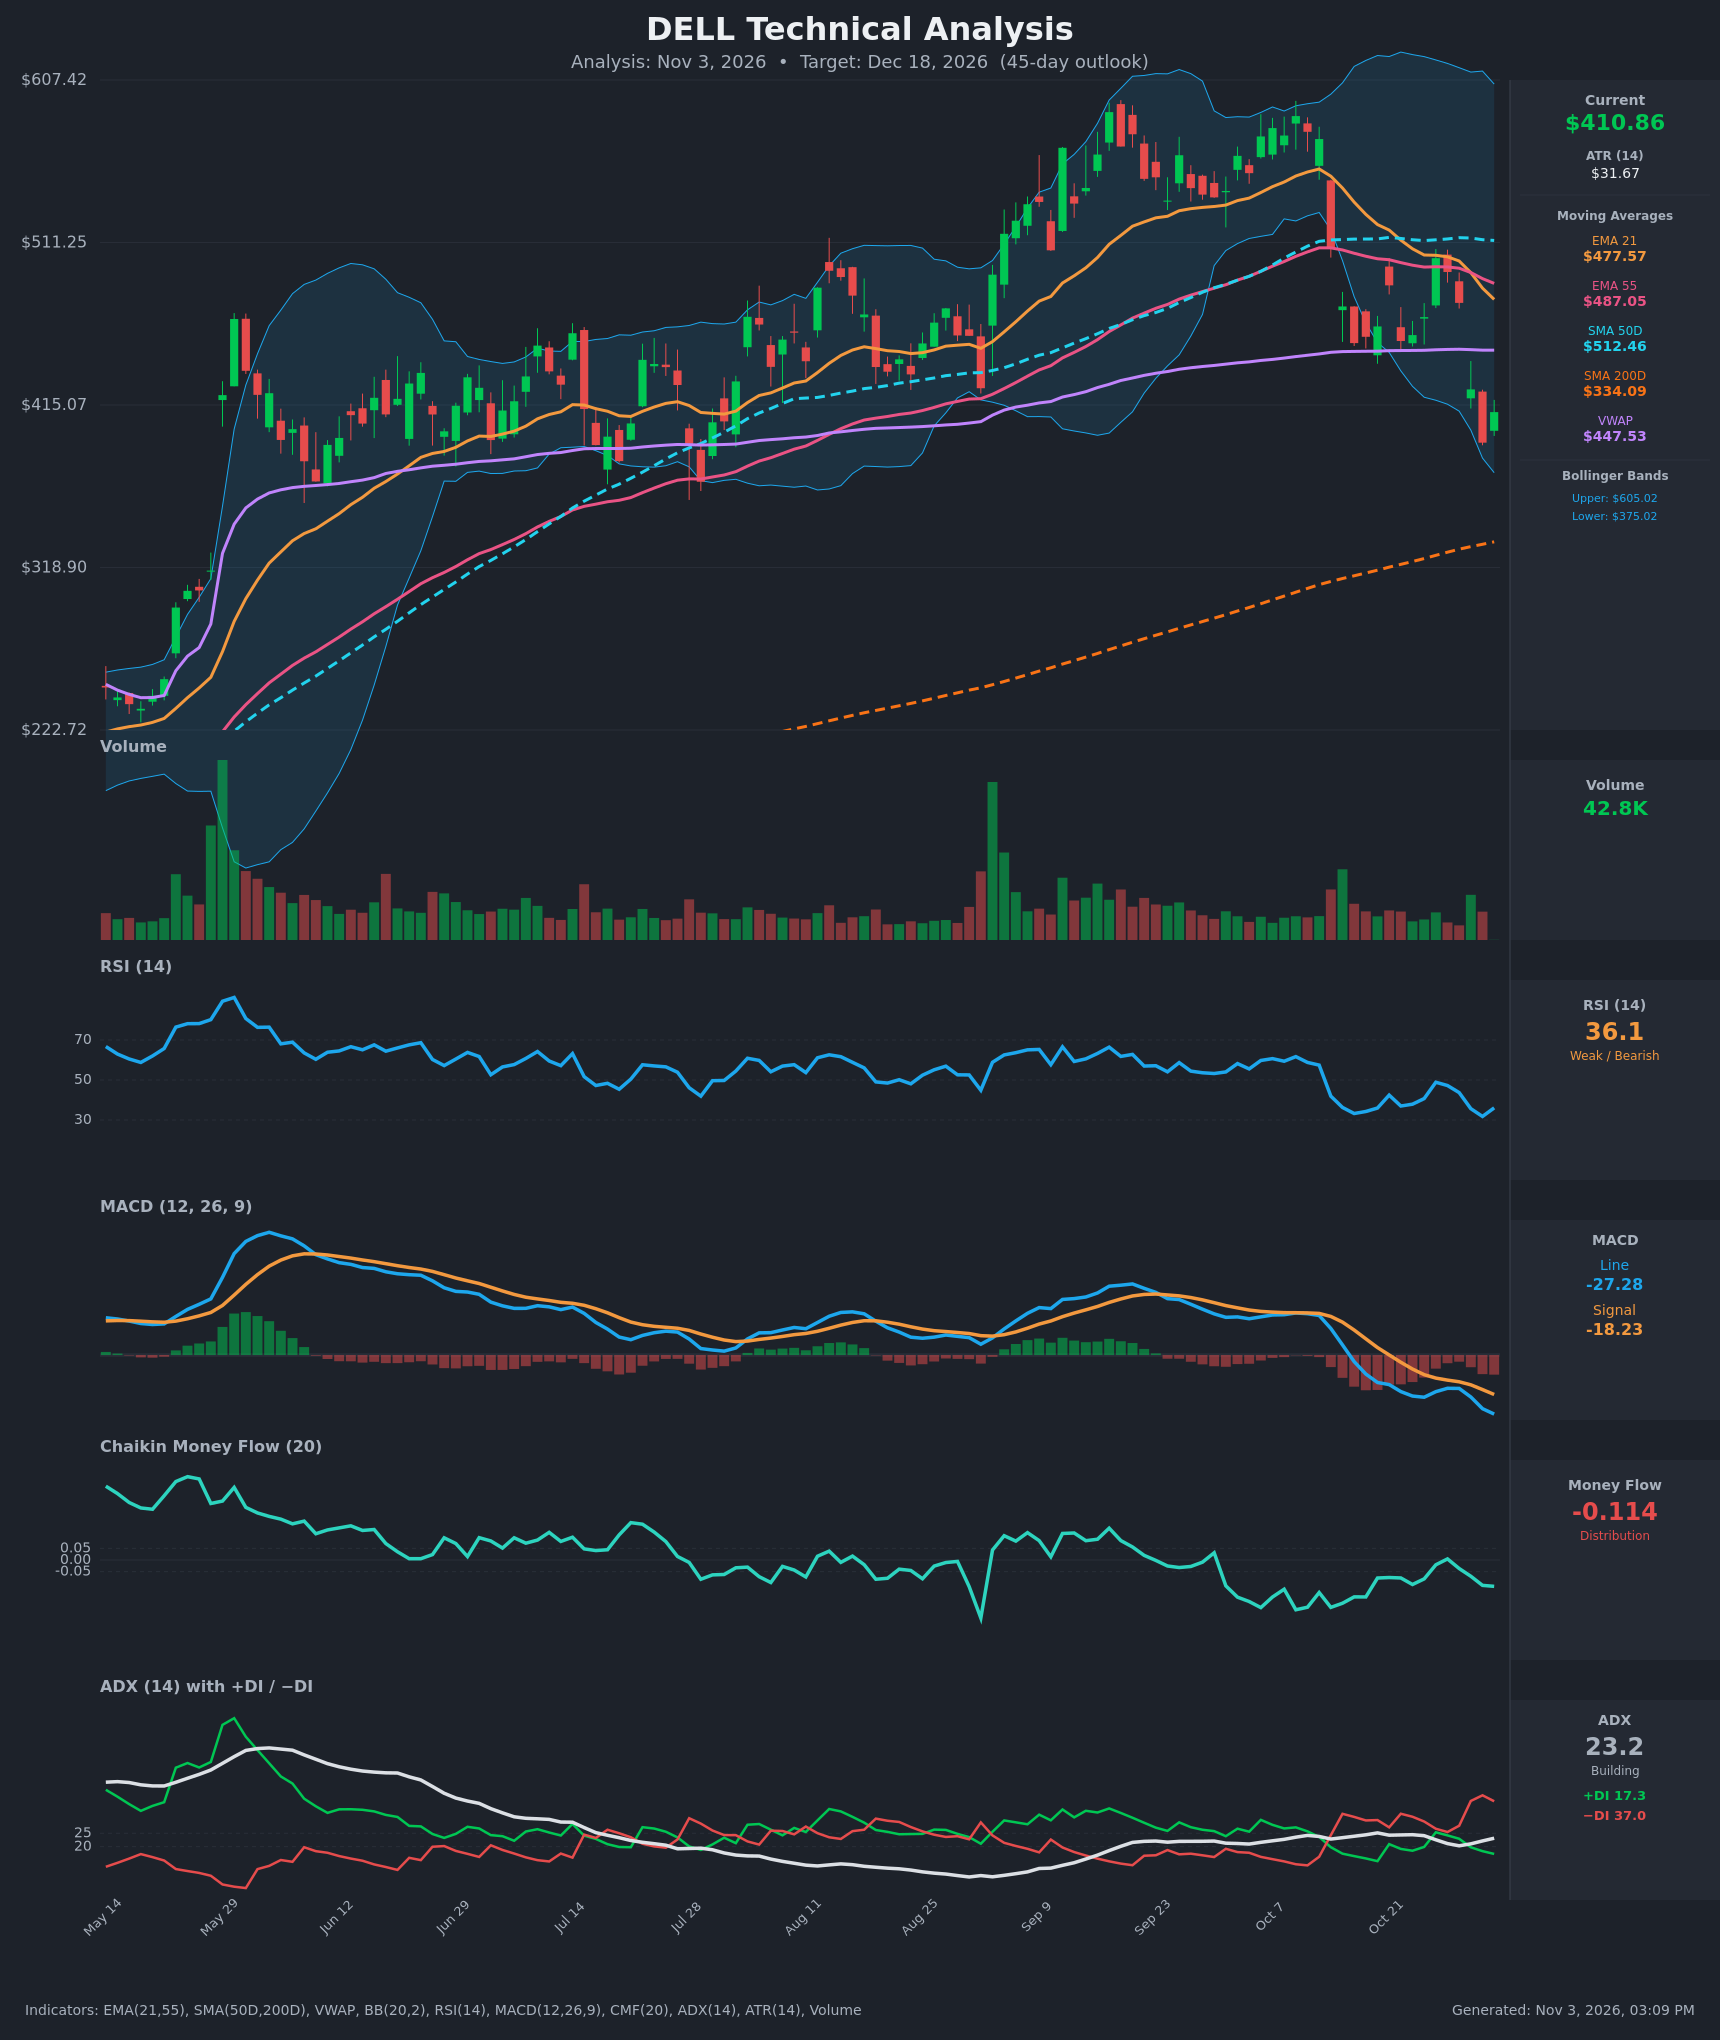
- RSI (14): 36.07, down from the high 40s in late October and near the 30 oversold line. It bottomed at 31.8 on Nov 2 and ticked up, so momentum is weak but starting to stabilize. [Bearish]
- 20 EMA (EMA 21): $477.57, with price at $410.86, about 14% below it. The EMA is falling steeply and now sits below the EMA 55 ($487.05), so it acts as overhead resistance. [Bearish]
- MACD: Line -27.28 is below the signal at -18.23, and the gap is widening. The histogram is increasingly negative. The bearish crossover happened around Oct 15-16, and the line keeps making new lows. [Bearish]
- Bollinger Bands (20): Upper $605.02, lower $375.02. Price is in the lower third of the bands, about $36 above the lower band. The bands are very wide after a volatile run. The Nov 2 close of $392.78 was near the lower band and bounced. A touch or brief breach would be normal in a downtrend and could set up a relief bounce. [Bearish]
- CMF (20): -0.114, below the -0.05 threshold. It has been negative for most of the past 6 weeks, which points to persistent distribution. [Distribution]
- ADX (14): 23.2 and rising, near the 25 trend threshold. -DI at 37.0 is far above +DI at 17.3, so bears are firmly in control and the trend is strengthening. [Strong Trend + Bearish]
- Volume: 42.8K, which is light and shows no capitulation spike on the recent selloff. The red bars on the Oct 30 and Nov 2 drops were not exceptional. Selling is steady and orderly rather than panicked. [Neutral-to-Bearish]
DIVERGENCES & TRENDS
- No clear bullish divergence yet. RSI made a higher low (31.8 on Nov 2 vs 33.2 on Oct 16) while price made a lower low ($392.78 vs $451.71). That is an early, tentative bullish divergence, but MACD and CMF are not confirming it.
- The MACD bearish crossover (~Oct 16) and the negative histogram show momentum still accelerating down.
- EMA 21 crossed below EMA 55 on Oct 30 (a bearish crossover). Price is below EMA 21, EMA 55, SMA 50D ($512.46) and VWAP ($447.53).
- SMA 50D ($512.46) is far above SMA 200D ($334.09), so there is no death cross. The long-term trend is still up, with price roughly 23% above the 200D.
- The -DI crossover over +DI happened on Oct 15, and the gap has widened since.
- Price broke below the Oct consolidation (~$450-$500) and below VWAP, which had been support through September-October.
CHART PATTERNS
- Bearish Head and Shoulders / Double Top (reversal): The Sep-Oct peak near $580-$600 and the subsequent lower high near $500 fit a broad topping structure. The breakdown below the $450 neckline area (VWAP ~$447) confirms it. The measured move from a ~$590 head to a ~$450 neckline is about $140, which projects to roughly $310. That is an aggressive target and would take longer than 45 days. The SMA 200D (~$334-$340) is the natural magnet.
- Bearish Flag/Pennant: The Oct 26-28 bounce to ~$500 followed by the drop looks like a failed rebound. The measured move is consistent with continued downside.
- Near-term, price near the lower Bollinger Band and an RSI approaching 30 argue for a relief bounce into $440-$460 (the VWAP / gap-fill zone) before the trend resumes.
POTENTIAL SCENARIOS
- Scenario 1: Bearish Trend Continuation — The topping structure resolves lower after a brief bounce fails near the declining EMAs and VWAP. Trigger: a daily close below $392 (the Nov 2 low) and the lower Bollinger Band at $375. Target: $340-$375, with the SMA 200D (~$334-$340) as the main support. Invalidation: a daily close above $450 (VWAP). (50% probability)
- Scenario 2: Neutral Consolidation and Relief Bounce — Oversold conditions and the early RSI divergence produce a bounce to $430-$460 and chop between $375 and $460. Trigger: RSI holding above 30 and price reclaiming $430. Target: $440-$460. Invalidation: a close below $375 or above $480. (30% probability)
- Scenario 3: Bullish Reversal — Dip buyers defend the lower band and price reclaims the VWAP and EMA 21. Trigger: a close above $450 on rising volume with MACD flattening. Target: $477-$510 (EMA 21 / SMA 50D). Invalidation: a close below $392. (20% probability)
PRICE TARGETS
- Target Price: $385.00 (45-day). This reflects a drift toward the lower Bollinger Band and the SMA 200D, tempered by the likelihood of an oversold bounce along the way.
- Expected Range: $330.00 to $462.00 (width $132, about 32% of the current price). This is somewhat wider than the 12-18% guidance for 30-60 days. I widened it on purpose because ATR is high ($31.67, about 7.7% of price), so a tighter range would be unrealistic for this stock.
- Key Levels: Support at $375.00 (lower Bollinger Band; below that, the SMA 200D at ~$334). Resistance at $447.53 (VWAP, followed by EMA 21 at $477.57).
OVERALL BIAS
OVERALL BIAS: BEARISH - Price is below all the key short- and medium-term moving averages and VWAP. MACD is deepening below its signal line, −DI is far above +DI with ADX rising, and CMF shows persistent distribution. A relief bounce is possible from oversold levels, but the path of least resistance is toward $375 and the SMA 200D.
This is educational analysis and not financial advice.