NVDA 31-day bearish forecast — Nov 3, 2026
- Bias: Bearish
- Timeframe: 31 days (made Nov 3, 2026, target date Dec 3, 2026)
- Price at analysis: $207.53
- Price target: $201.00
- Expected range: $186.00 – $219.00
- Result: Pending — graded after the close on Dec 3, 2026
Get a free AI analysis of NVDA today
Analysis
TECHNICAL INDICATORS
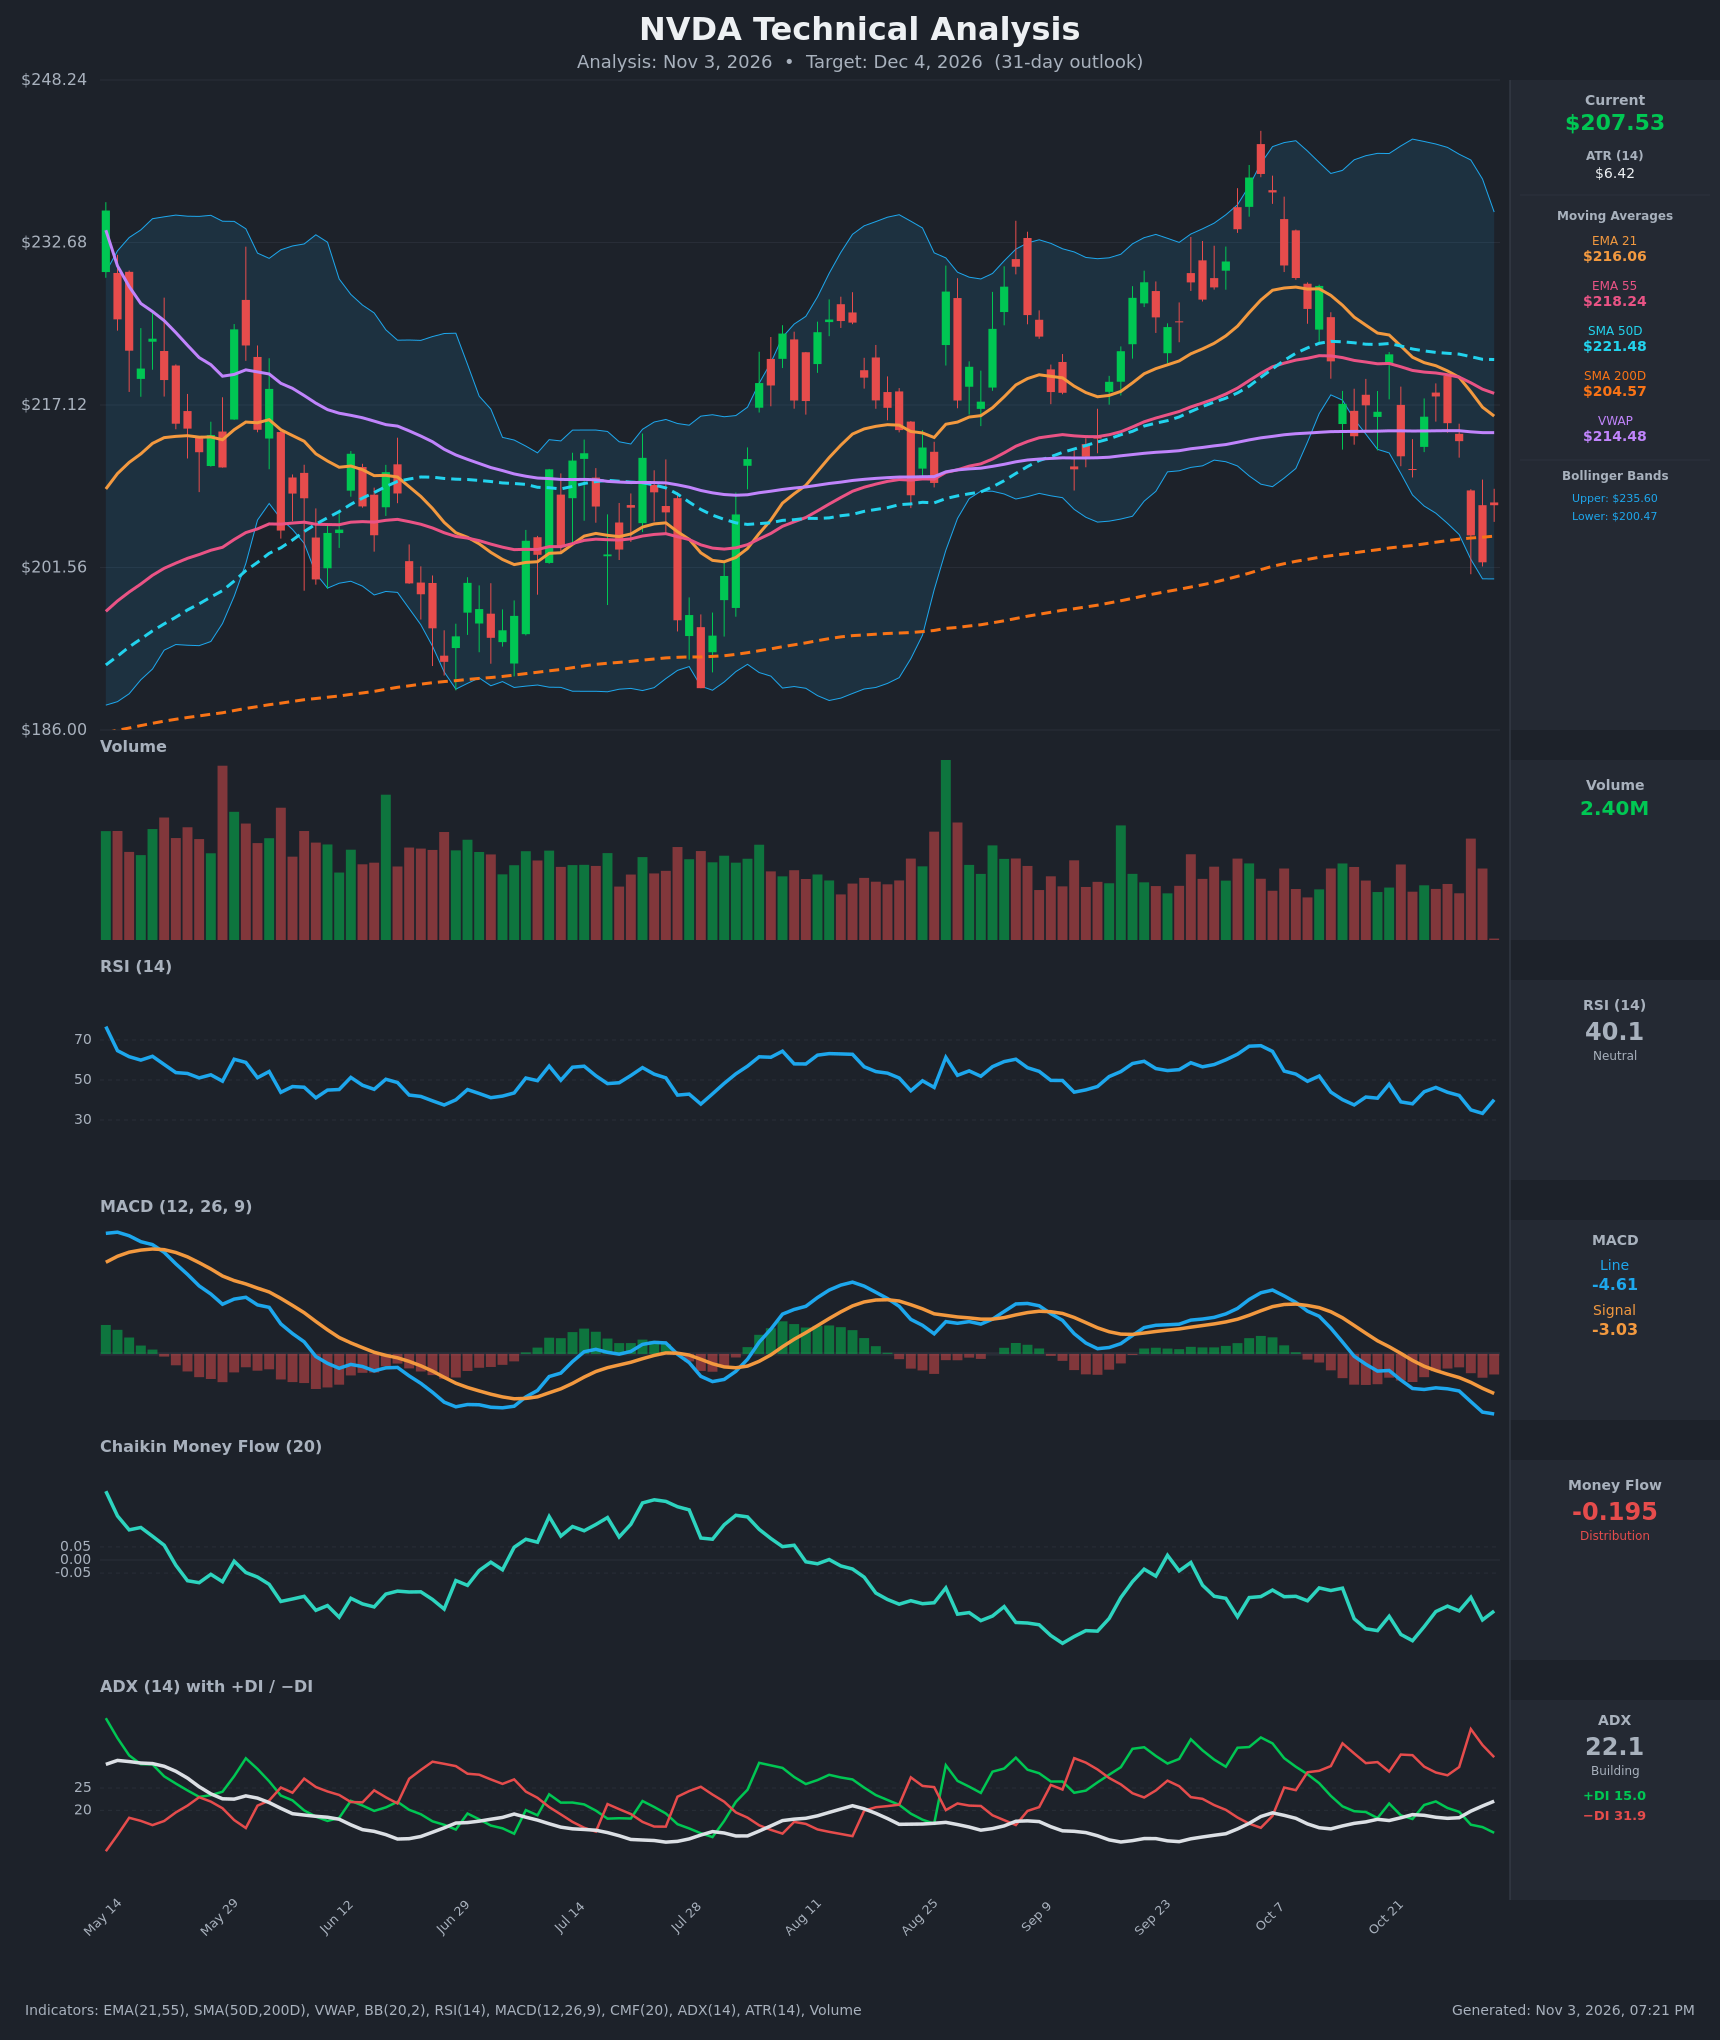
- RSI (14): 40.13, rising from 33.3 two days ago after a dip toward oversold. It has been below 50 for most of the past three weeks, with lower highs (47.9 on Oct 21, 46.3 on Oct 27). Momentum is weak with a minor bounce. [Bearish]
- 20 EMA: The 21 EMA is $216.06 and falling steeply. Price at $207.53 is about 4% below it, so it acts as resistance. EMA21 is also below EMA55 ($218.24), a bearish crossover that occurred around Oct 29. [Bearish]
- MACD: Line -4.605 is below signal -3.031 and both are below zero. The bearish crossover happened around Oct 16 and the gap is widening, with the histogram negative at about -1.57 and expanding. [Bearish]
- Bollinger Bands (20): Upper $235.60, lower $200.47, middle about $218. Price is in the lower third, about $7 above the lower band, after touching it on Nov 2. The bands are starting to contract from a wide range. A lower-band walk is possible, but a mean-reversion bounce toward the middle band is also possible. [Bearish]
- CMF (20): -0.195, well below -0.05 and negative for weeks (range -0.14 to -0.31). This shows persistent distribution. [Distribution]
- ADX (14): 22.1 and rising from 15.9. +DI is 15.0 and −DI is 31.9, so bears are firmly in control. ADX is just under the strong-trend threshold, and a rise through 25 would confirm a downtrend. [Weak-to-Building Trend, Bearish]
- Volume: 2.40M, with recent heavy-volume red candles on the Oct 30 and Nov 2 breakdown. The latest bounce came on average-to-modest volume, which is not convincing buying. [Selling pressure dominant]
DIVERGENCES & TRENDS
- No bullish RSI or MACD divergence is confirmed. The RSI low of 33.3 came with a price low of $202.06, and MACD is still making new lows (-4.605), so momentum confirms price.
- Moving averages: Price is below EMA21, EMA55, SMA50D ($221.48) and VWAP ($214.48). It is still above the SMA200D ($204.57), which is the key long-term support, only about 1.4% below price.
- Crossovers: EMA21 crossed below EMA55 (bearish). SMA50D remains well above SMA200D, so there is no death cross yet, but the gap is narrowing.
- Price structure: The chart shows a peak near $242 in early October followed by lower highs and a lower low. The lower Bollinger Band and SMA200D cluster at about $200–205.
- DI trend: −DI has been above +DI for the entire recent window, and the spread is widening.
CHART PATTERNS
- Bearish Head and Shoulders / Double Top (loosely): The early-October peak near $242 and the lower high near $230 (late Sept/mid-Oct) with a breakdown below $213 resemble a rolling-over top. The neckline sits around $201–205, which coincides with SMA200D support. A break would project a measured move toward the high $180s.
- Bearish Flag/Pennant: The Oct 14–29 sideways drift between $210 and $222 followed by the Oct 30 drop is a flag-like consolidation that resolved lower, a continuation signal.
- Support to watch: The $200–205 zone (lower BB, SMA200D, and the Nov 2 low) is the make-or-break area. The September–October lower highs add overhead supply.
POTENTIAL SCENARIOS
- Scenario 1: Bearish Breakdown Below SMA200D — Price loses the $202 low and the SMA200D, with the neckline break and expanding −DI pushing ADX above 25. Trigger: Daily close below $201.50 on rising volume. Target: $188–$195. Invalidation: Daily close back above $218 (EMA55). (45% probability)
- Scenario 2: Neutral/Bullish Relief Bounce and Range — Oversold RSI and SMA200D support produce a rebound toward the 21 EMA, VWAP and middle band, then stall under resistance. Trigger: Hold above $202 and a close above $214.50 (VWAP). Target: $214–$220. Invalidation: Close below $200. (35% probability)
- Scenario 3: Bullish Reversal — A strong rebound reclaims the EMAs and SMA50D, with CMF turning positive. Trigger: Close above $222 on strong volume. Target: $230–$236. Invalidation: Rejection at $218 and a drop below $205. (20% probability)
PRICE TARGETS
For the 31-day timeframe (range should be ~12–18% of price, about $25–$37):
- Target Price: $201.00 (bearish bias; the weight of the evidence favors a drift lower toward and slightly through the SMA200D and lower Bollinger Band, partly offset by the chance of a bounce)
- Expected Range: $186.00 to $219.00 (width $33, about 15.9% of current price)
- Key Levels: Support at $202.06 (Nov 2 low, with SMA200D at $204.57 just above), Resistance at $216.06 (EMA21), with stronger resistance at $221.48 (SMA50D)
OVERALL BIAS
OVERALL BIAS: BEARISH - Price is below the EMA21, EMA55, SMA50D and VWAP, MACD is negative with a widening gap below its signal, −DI (31.9) dominates +DI (15.0) with ADX rising, and CMF at -0.195 shows persistent distribution. The SMA200D and lower Bollinger Band near $200–205 are the key support, and a bounce is likely to meet resistance at $214–$218 first.
This is educational analysis and not financial advice.