SPY 2-day bearish forecast — Nov 3, 2026
- Bias: Bearish
- Timeframe: 2 days (made Nov 3, 2026, target date Nov 4, 2026)
- Price at analysis: $754.41
- Price target: $751.80
- Expected range: $744.50 – $761.00
- Result: Incorrect (+1.7%) — closed at $767.40 on Nov 4, 2026; quality score 31/100
Get a free AI analysis of SPY today
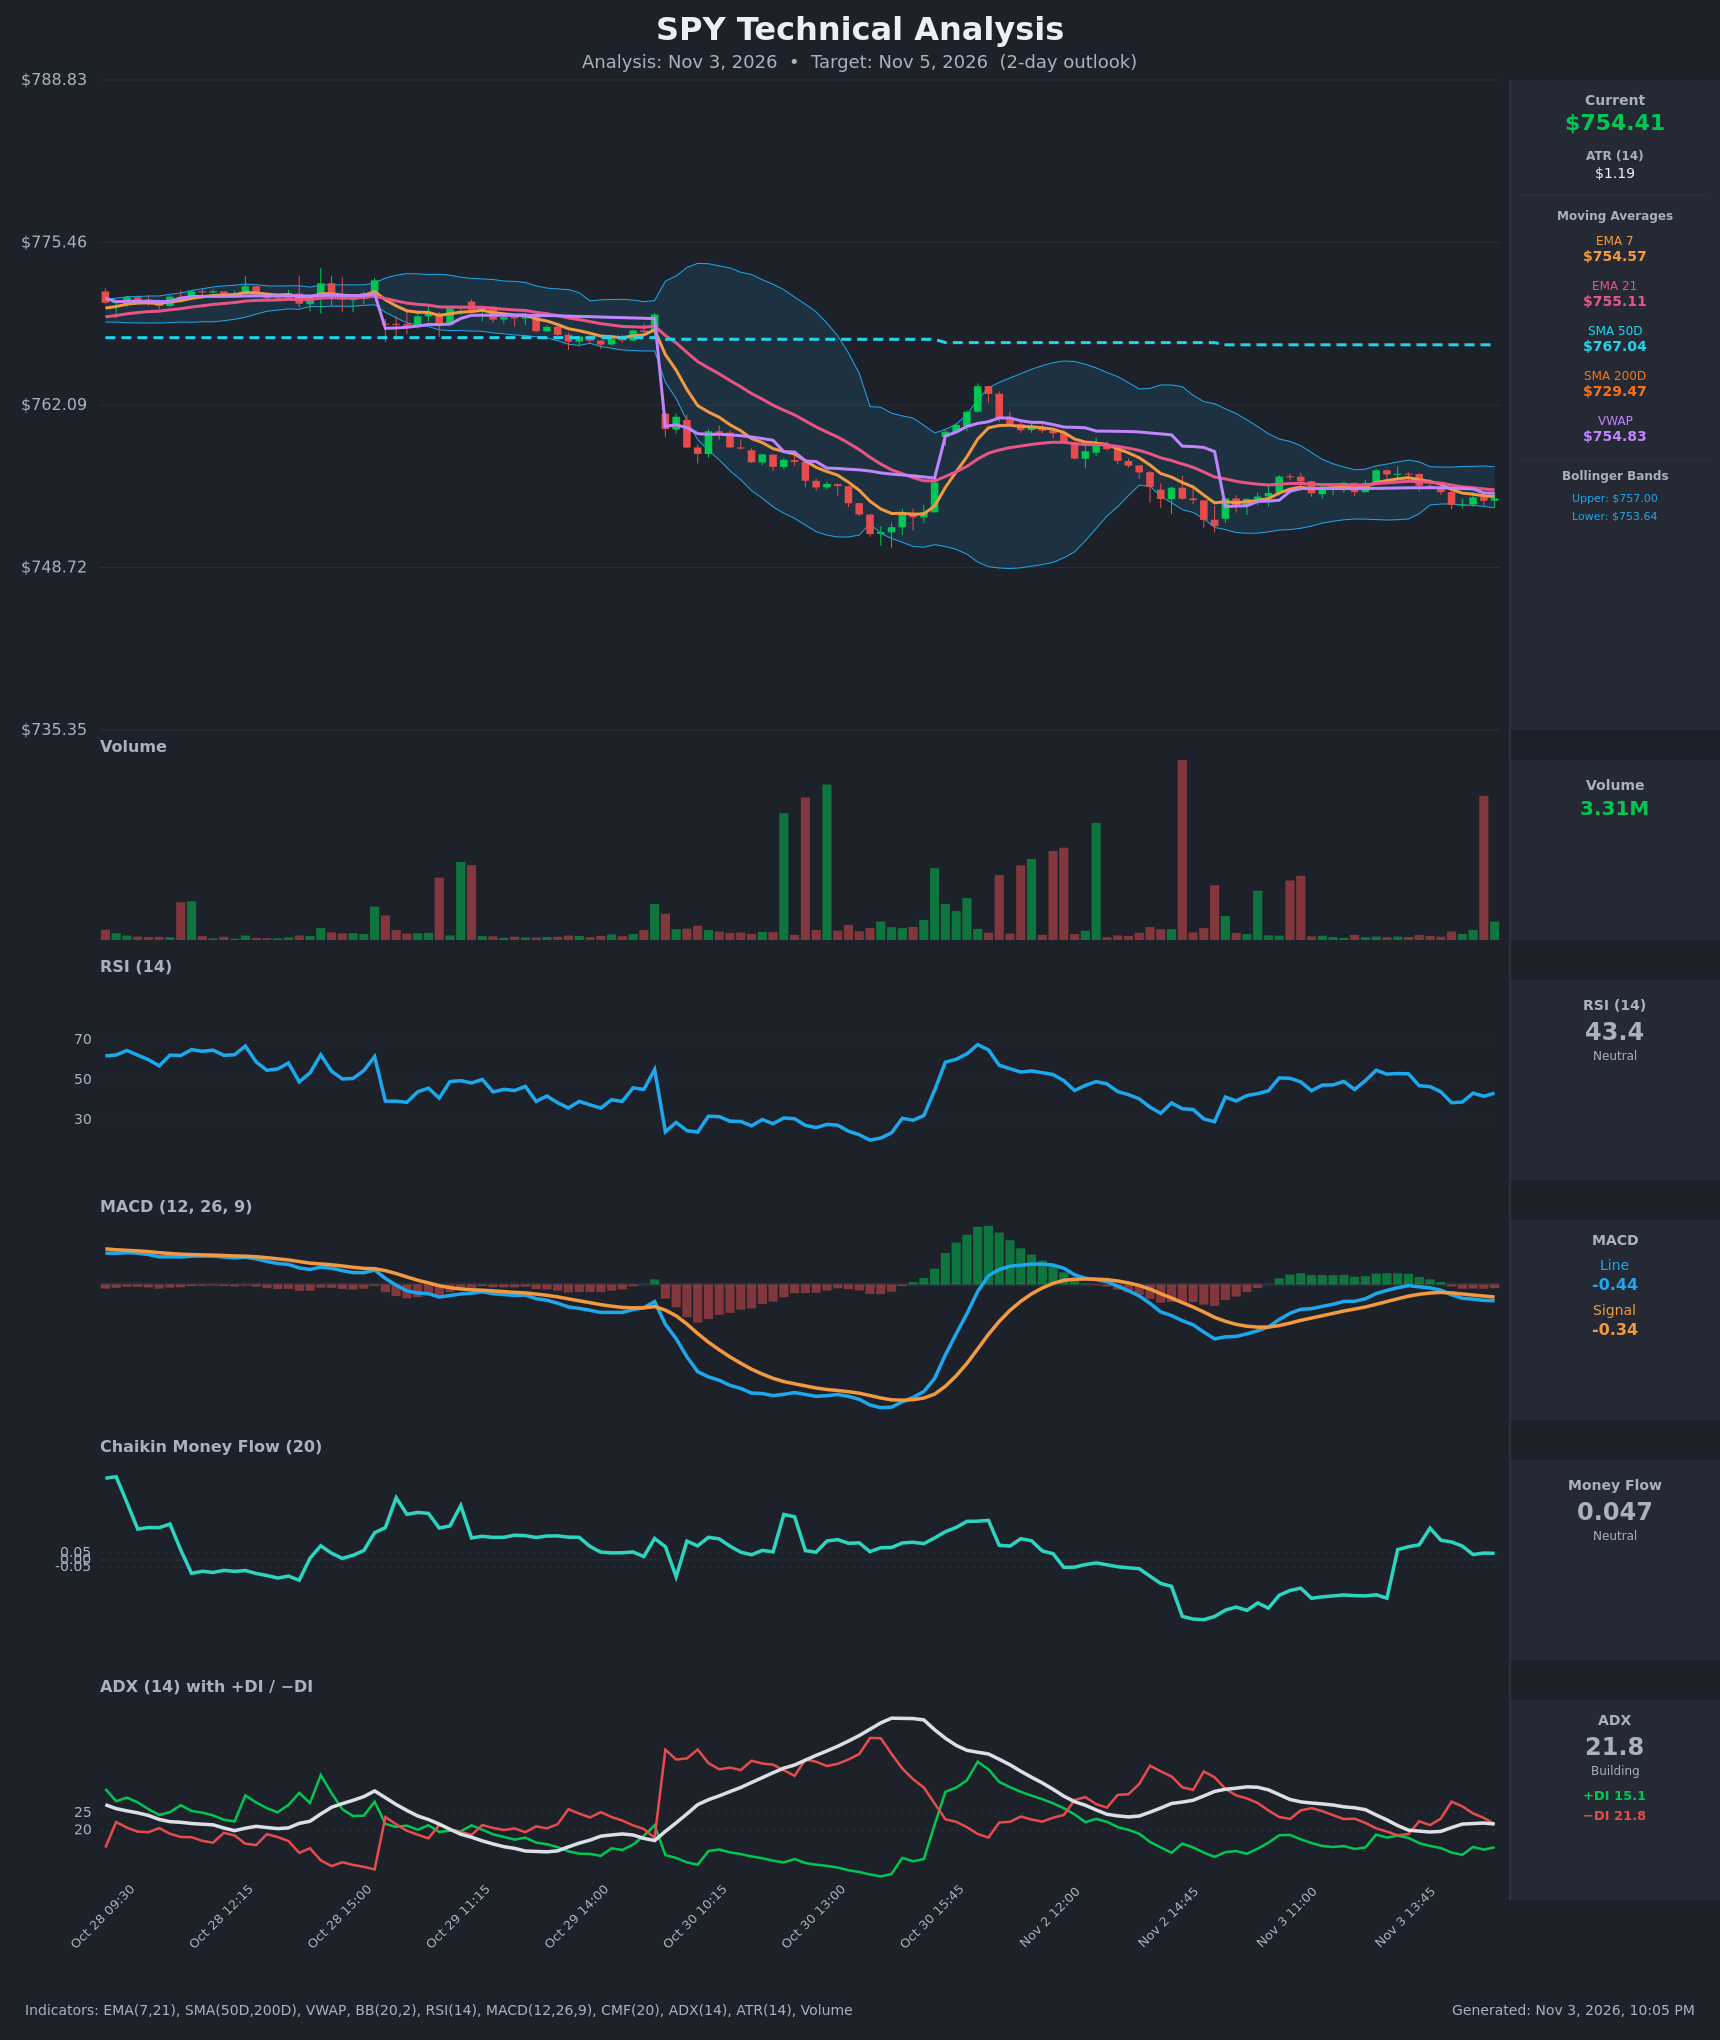
Analysis
TECHNICAL INDICATORS
- RSI (14): 43.44, below the 50 midline and well off the 54.9 reading at 13:00. It has stayed in a 39-45 band since 14:30, so momentum is soft but not oversold. [Bearish]
- 20 EMA: The chart shows EMA 7 ($754.57) and EMA 21 ($755.11). Price at $754.41 is below both, and EMA 7 has been below EMA 21 since about 14:30. The bearish cross is fresh and the EMAs are only about $0.55 apart, so the signal is mild. EMA 21 is the first resistance. [Bearish]
- MACD: The line (-0.440) is below the signal (-0.341) after a bearish cross around 14:45. The histogram is slightly negative and widening, while both lines remain below zero. [Bearish]
- Bollinger Bands (20): Upper $757.00, lower $753.64. The bands are very narrow, a squeeze after the volatile mid-week swing. Price sits in the lower third, about $0.77 above the lower band. A volatility expansion is likely, and the direction is undecided. [Neutral]
- CMF (20): 0.047, just under the +0.05 accumulation threshold. It has been mildly positive since 13:30 after a negative stretch. That is neutral, with a slight positive tilt. [Neutral]
- ADX (14): 21.8, in the borderline zone. It is down from 26.8 earlier in the session, so the trend is weak. −DI (21.8) is above +DI (15.1), so bears have the edge but without a strong trend. [Weak Trend, Bearish lean]
- Volume: The latest bar is 3.31M, with a notable spike on a recent down bar, and the intraday sessions show light volume during the consolidation. Selling spikes have been larger than buying spikes. Price is below VWAP ($754.83), which shows mild selling pressure. [Mildly Bearish]
DIVERGENCES & TRENDS
- There is no clear divergence. RSI and MACD are both making lower readings alongside flat-to-lower price.
- Price is below the SMA50 ($767.04), so the medium-term trend is down. It is well above the SMA200 ($729.47), so the long-term uptrend is intact.
- The MACD bearish cross (-0.440 vs -0.341) and the EMA 7/21 cross both occurred in the last two hours.
- CMF is slightly positive while price drifts lower. That is a minor, unconfirmed mismatch and a reason for modest conviction.
- ADX is falling from 26.8 to 21.8, so the earlier downtrend momentum is fading into consolidation. DI spread favors the bears.
CHART PATTERNS
- After the sharp drop from about $770 to $750 and the bounce to about $763, price is making lower highs ($763, then about $757) against support near $750-751. This resembles a Descending Triangle / Bearish Pennant continuation, with a measured-move bias lower.
- The squeezing Bollinger Bands support a coiling structure. The pattern is not confirmed until price breaks below roughly $753.50 and then the $750 swing low.
- A confirmed breakdown would target about $746-747, from the pattern height projected down. A move back above EMA 21/VWAP at about $755-757 would invalidate the bearish read.
POTENTIAL SCENARIOS
- Scenario 1: Bearish Breakdown from Coil — Price loses the lower Bollinger Band as sellers press with the MACD and −DI advantage. Trigger: close below $753.60 and then below $750.50. Target: $747.00-$749.00. Invalidation: a close above $757.00. (50% probability)
- Scenario 2: Neutral Range Persistence — Price keeps chopping between $750.50 and $757 as ADX stays weak and CMF stays neutral. Trigger: failure to break either band edge. Target: $753-$756. Invalidation: a decisive break of $750 or $757.50. (28% probability)
- Scenario 3: Bullish Squeeze Break — Slightly positive CMF and buyers defending the $750 area produce a push above EMA 21 and VWAP. Trigger: close above $757.00. Target: $760-$763, the prior swing high. Invalidation: a close back below $753.60. (22% probability)
PRICE TARGETS
- Target Price: $751.80 (Nov 5 close, 2-day outlook)
- Expected Range: $744.50 to $761.00. The width is $16.50, or about 2.2% of the current price, which fits the 2-3 day guidance.
- Key Levels: Support at $750.00, Resistance at $757.00
OVERALL BIAS
OVERALL BIAS: BEARISH - Price is below EMA 7, EMA 21 and VWAP, MACD has crossed bearishly, −DI is above +DI, and lower highs point to a coiling continuation pattern. Conviction is modest because ADX is weak, CMF is neutral and the Bollinger Bands are squeezed.
This is educational analysis and not financial advice.