NVDA 118-day bearish forecast — Nov 4, 2026
- Bias: Bearish
- Timeframe: 118 days (made Nov 4, 2026, target date Mar 1, 2027)
- Price at analysis: $203.28
- Price target: $188.00
- Expected range: $168.00 – $216.00
- Result: Pending — graded after the close on Mar 1, 2027
Get a free AI analysis of NVDA today
Analysis
TECHNICAL INDICATORS
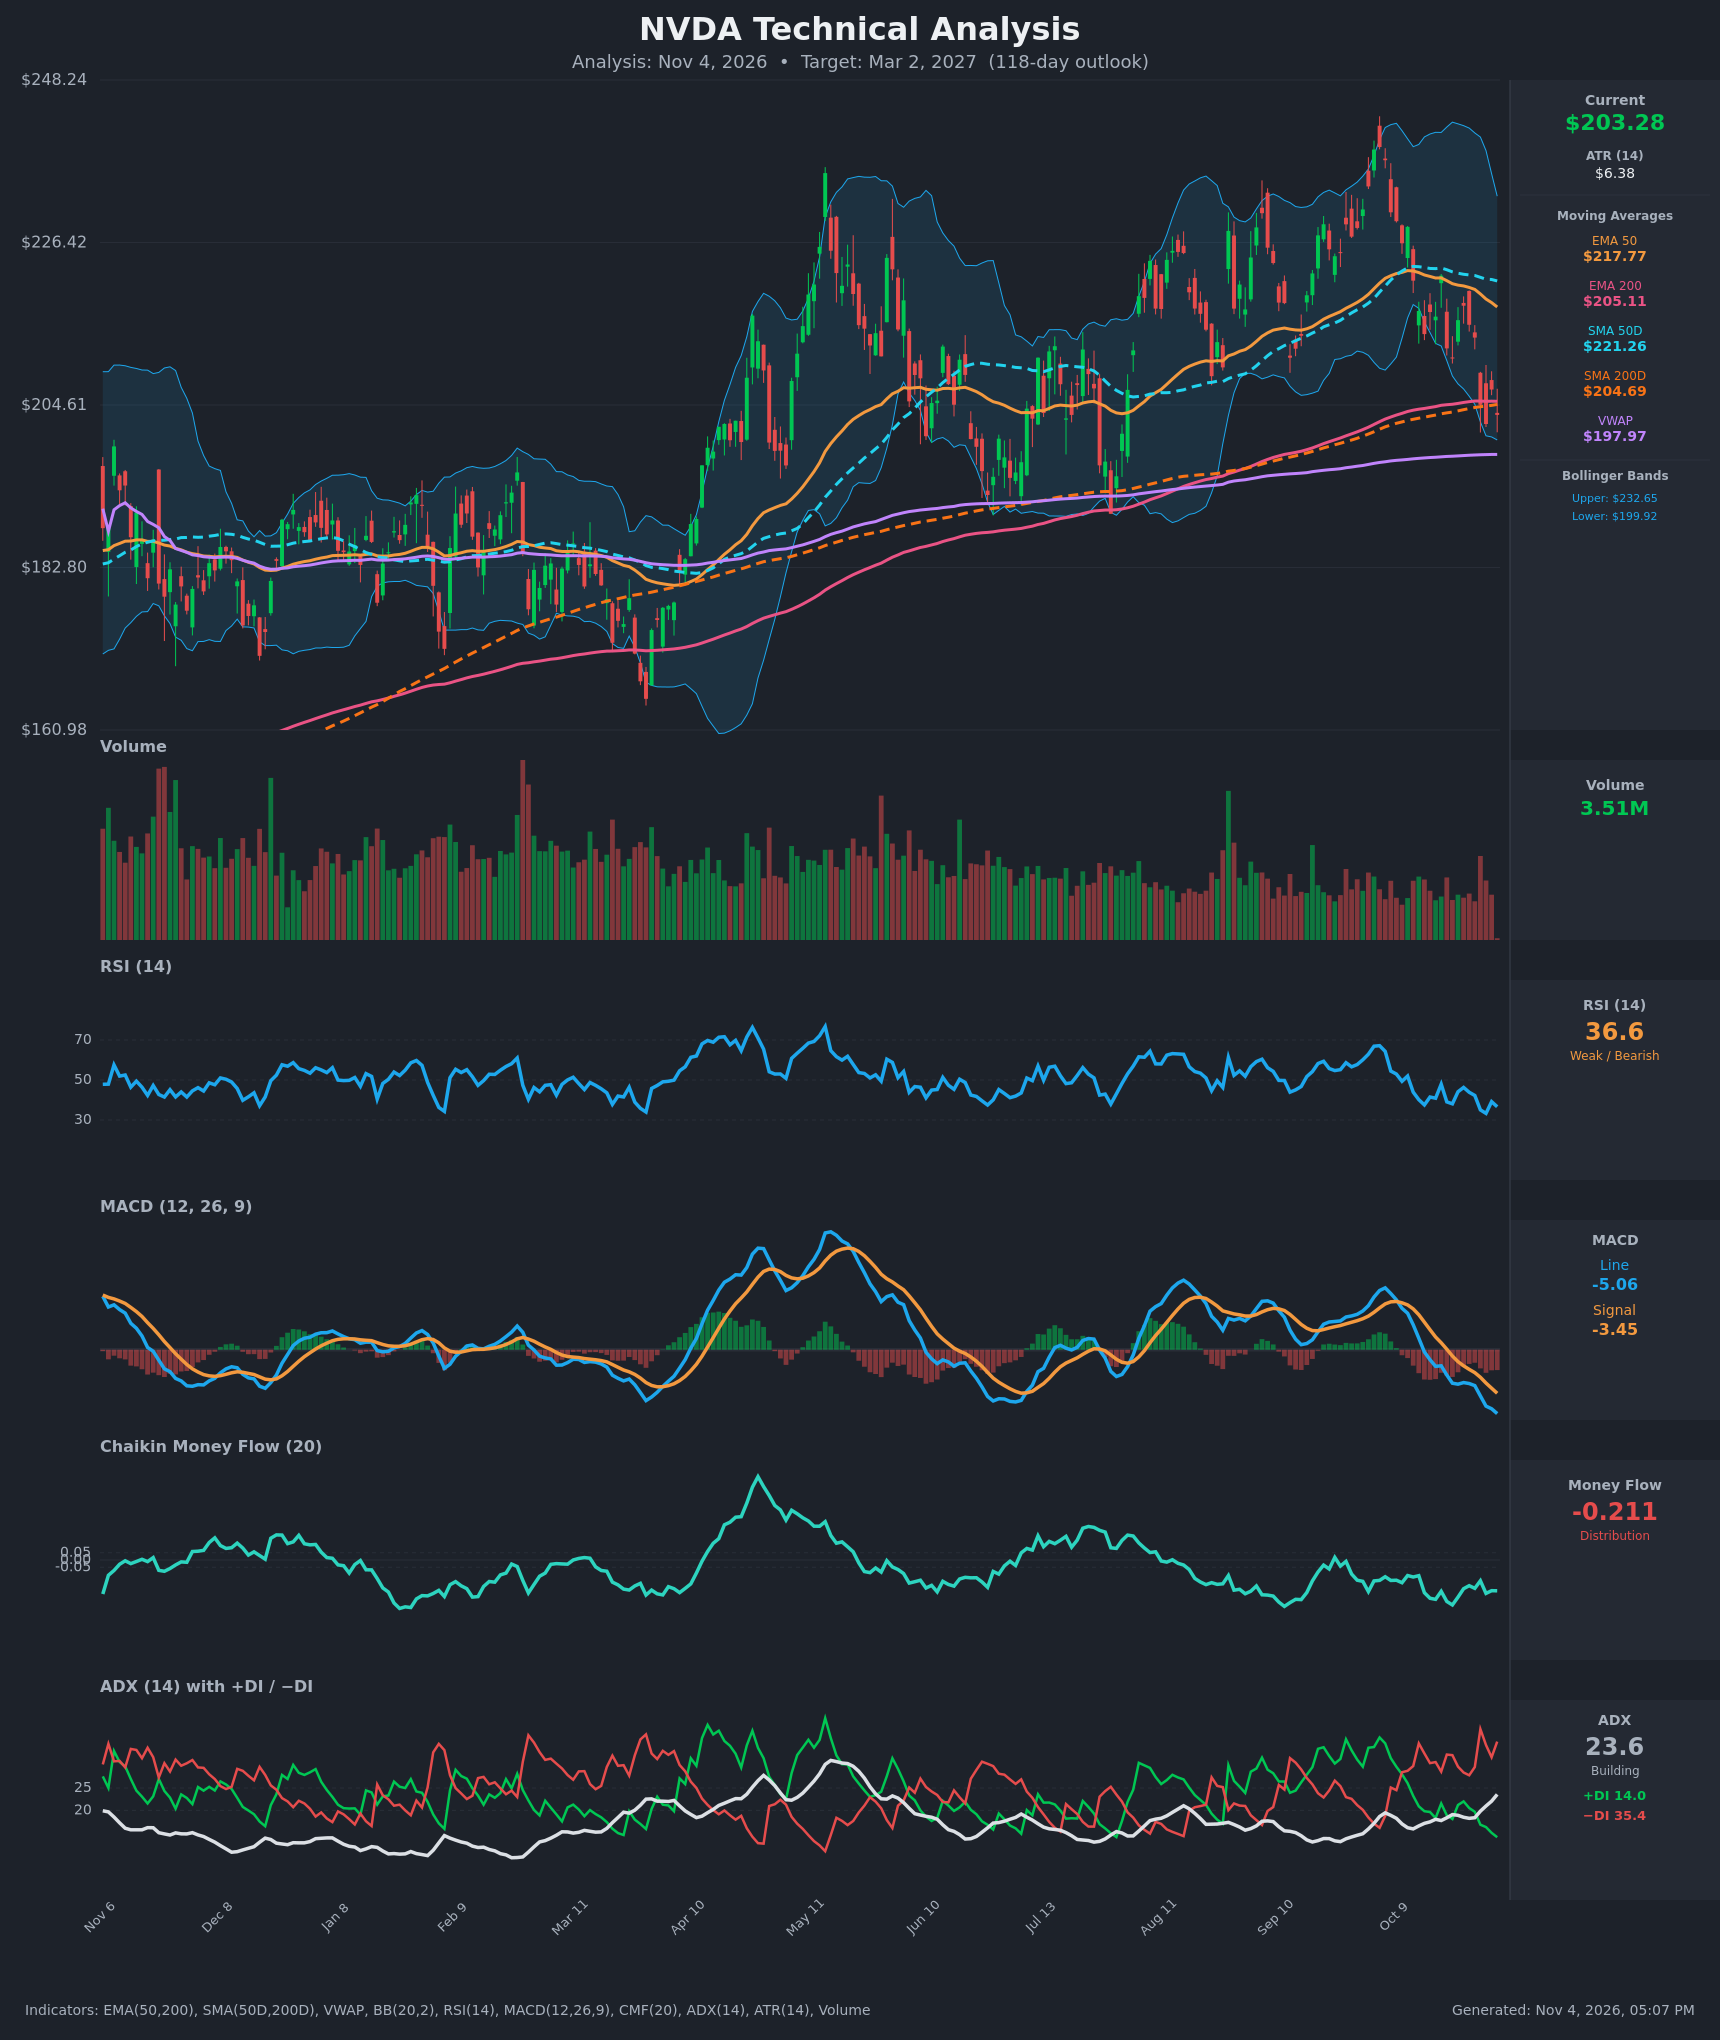
- RSI (14): 36.62, near oversold but not at the 30 threshold. It fell from 47.9 on Oct 21 and hit 33.3 on Nov 2, with lower highs on each bounce. Momentum is weak and sellers are still in control. [Bearish]
- 20 EMA: Not supplied. The EMA 50 at $217.77 is the proxy, and price sits about 6.7% below it. It is falling and acts as resistance, along with the SMA 50D at $221.26. [Bearish]
- MACD: Line -5.06 is below signal -3.45. It crossed below around Oct 22-23, and the gap keeps widening. The histogram is negative and expanding, and the line is at its lowest in months. [Bearish]
- Bollinger Bands (20): Upper $232.65, lower $199.92. Price at $203.28 is in the lower quarter of the bands and about $3.4 above the lower band. The bands have rolled over from the October expansion. A close below $199.92 would signal a downside band walk. [Bearish]
- CMF (20): -0.211, well below -0.05. It has been negative for the whole recent stretch (-0.14 to -0.31), which shows persistent distribution, and no accumulation has appeared on the bounces. [Distribution]
- ADX (14): 23.6 and rising, from 16.5 on Oct 15. It is close to the 25 trend threshold. −DI (35.4) is far above +DI (14.0), so the developing trend is down. [Strong Trend building – Bearish]
- Volume: 3.51M, light against the prior spikes. Volume has been declining since the spring and is below average. Selling is orderly, not capitulative, so there is no washout bottom yet. [Neutral to mildly Bearish]
DIVERGENCES & TRENDS
- No bullish divergence. RSI is making lower lows as price drifts lower, and MACD and CMF are confirming the weakness.
- Moving averages: The EMA 50 ($217.77) and SMA 50D ($221.26) are rolling over. Price has slipped just below the EMA 200 ($205.11) and SMA 200D ($204.69), which are compressed and flat to slightly rising.
- Crossovers: There is no death cross yet, since the SMA 50D is still about $16.6 above the SMA 200D. The gap is narrowing, and the 50s are falling toward the 200s.
- MACD: The bearish crossover was around Oct 22-23, and the lines are still diverging.
- DI: −DI has been above +DI throughout the 15-bar window. The spread has widened to 21 points, and ADX is rising behind it.
- VWAP: Price is $5.31 above VWAP ($197.97), a minor support cushion. The VWAP line is rising slowly and sits just under the lower Bollinger Band.
- Failed highs: Price was rejected from about $245 in October and has lost roughly 17% since.
CHART PATTERNS
- Possible Bearish Double Top: Peaks near $233 (May) and about $245 (October) are roughly equal, with a neckline near $190-$195 formed by the June-August troughs. A close below the neckline would suggest a measured move toward the $140s. That is too extended for 118 days, so I only credit part of it.
- Rollover below the 200-day averages: Price is hugging the EMA 200 and SMA 200D confluence at about $205 and now trades slightly below it. Failure to reclaim the zone would make it resistance.
- Counter-pattern risk: A broader range of roughly $183-$245 has held since April. A bounce from the band lows back toward $218 would keep a Bullish Double Bottom / range-bound outcome alive.
POTENTIAL SCENARIOS
- Scenario 1: Bearish Breakdown Through the 200-Day Zone — Price fails to reclaim $205, loses the lower Bollinger Band, and the 50-day averages keep falling toward the 200s. Distribution (CMF) and −DI dominance with rising ADX support a drift toward the range lows and neckline area. Trigger: daily close below $199.92, then below $197.97 (VWAP). Target: $188, with an extension to $175-$183 (the March-April range floor and gap area). Invalidation: daily close above $218 (EMA 50) with MACD turning up. (50% probability)
- Scenario 2: Bullish Reclaim and Range Rebound — The 200-day MAs and lower band hold, RSI bounces from near-oversold, and price reclaims $205 and then the EMA 50. Trigger: close above $205.11 followed by a push through $217.77. Target: $221-$232 (SMA 50D, upper band). Invalidation: close below $199 after a failed reclaim. (30% probability)
- Scenario 3: Neutral Choppy Consolidation — Price oscillates around the 200-day averages between $190 and $218 as ADX stalls below 25. Trigger: ADX falling back below 20 with RSI back near 45-50. Target: $195-$210. Invalidation: close outside $188-$220. (20% probability)
PRICE TARGETS
- Target Price: $188.00 (118 days, about 7.5% below current)
- Expected Range: $168.00 to $216.00. The width is $48, or about 23.6% of the current price, which fits the 18-30% guidance for 61-180 days.
- Key Levels: Support at $197.97 (VWAP; $199.92 lower Bollinger Band just above it), Resistance at $217.77 (EMA 50; the $205 EMA/SMA 200 cluster is the first hurdle)
OVERALL BIAS
OVERALL BIAS: BEARISH - Price is below the falling 50-day averages and just under the 200-day cluster. MACD is bearish with a widening gap, CMF is at -0.21, and −DI dominates with ADX rising. The risk is a bounce off the lower band and 200-day support, so conviction is moderate.
This is educational analysis and not financial advice.