SPY 2-day bearish forecast — Nov 4, 2026
- Bias: Bearish
- Timeframe: 2 days (made Nov 4, 2026, target date Nov 5, 2026)
- Price at analysis: $766.73
- Price target: $764.50
- Expected range: $757.00 – $773.00
- Result: Correct (-4.4%) — closed at $733.00 on Nov 5, 2026; quality score 51/100
Get a free AI analysis of SPY today
Analysis
TECHNICAL INDICATORS
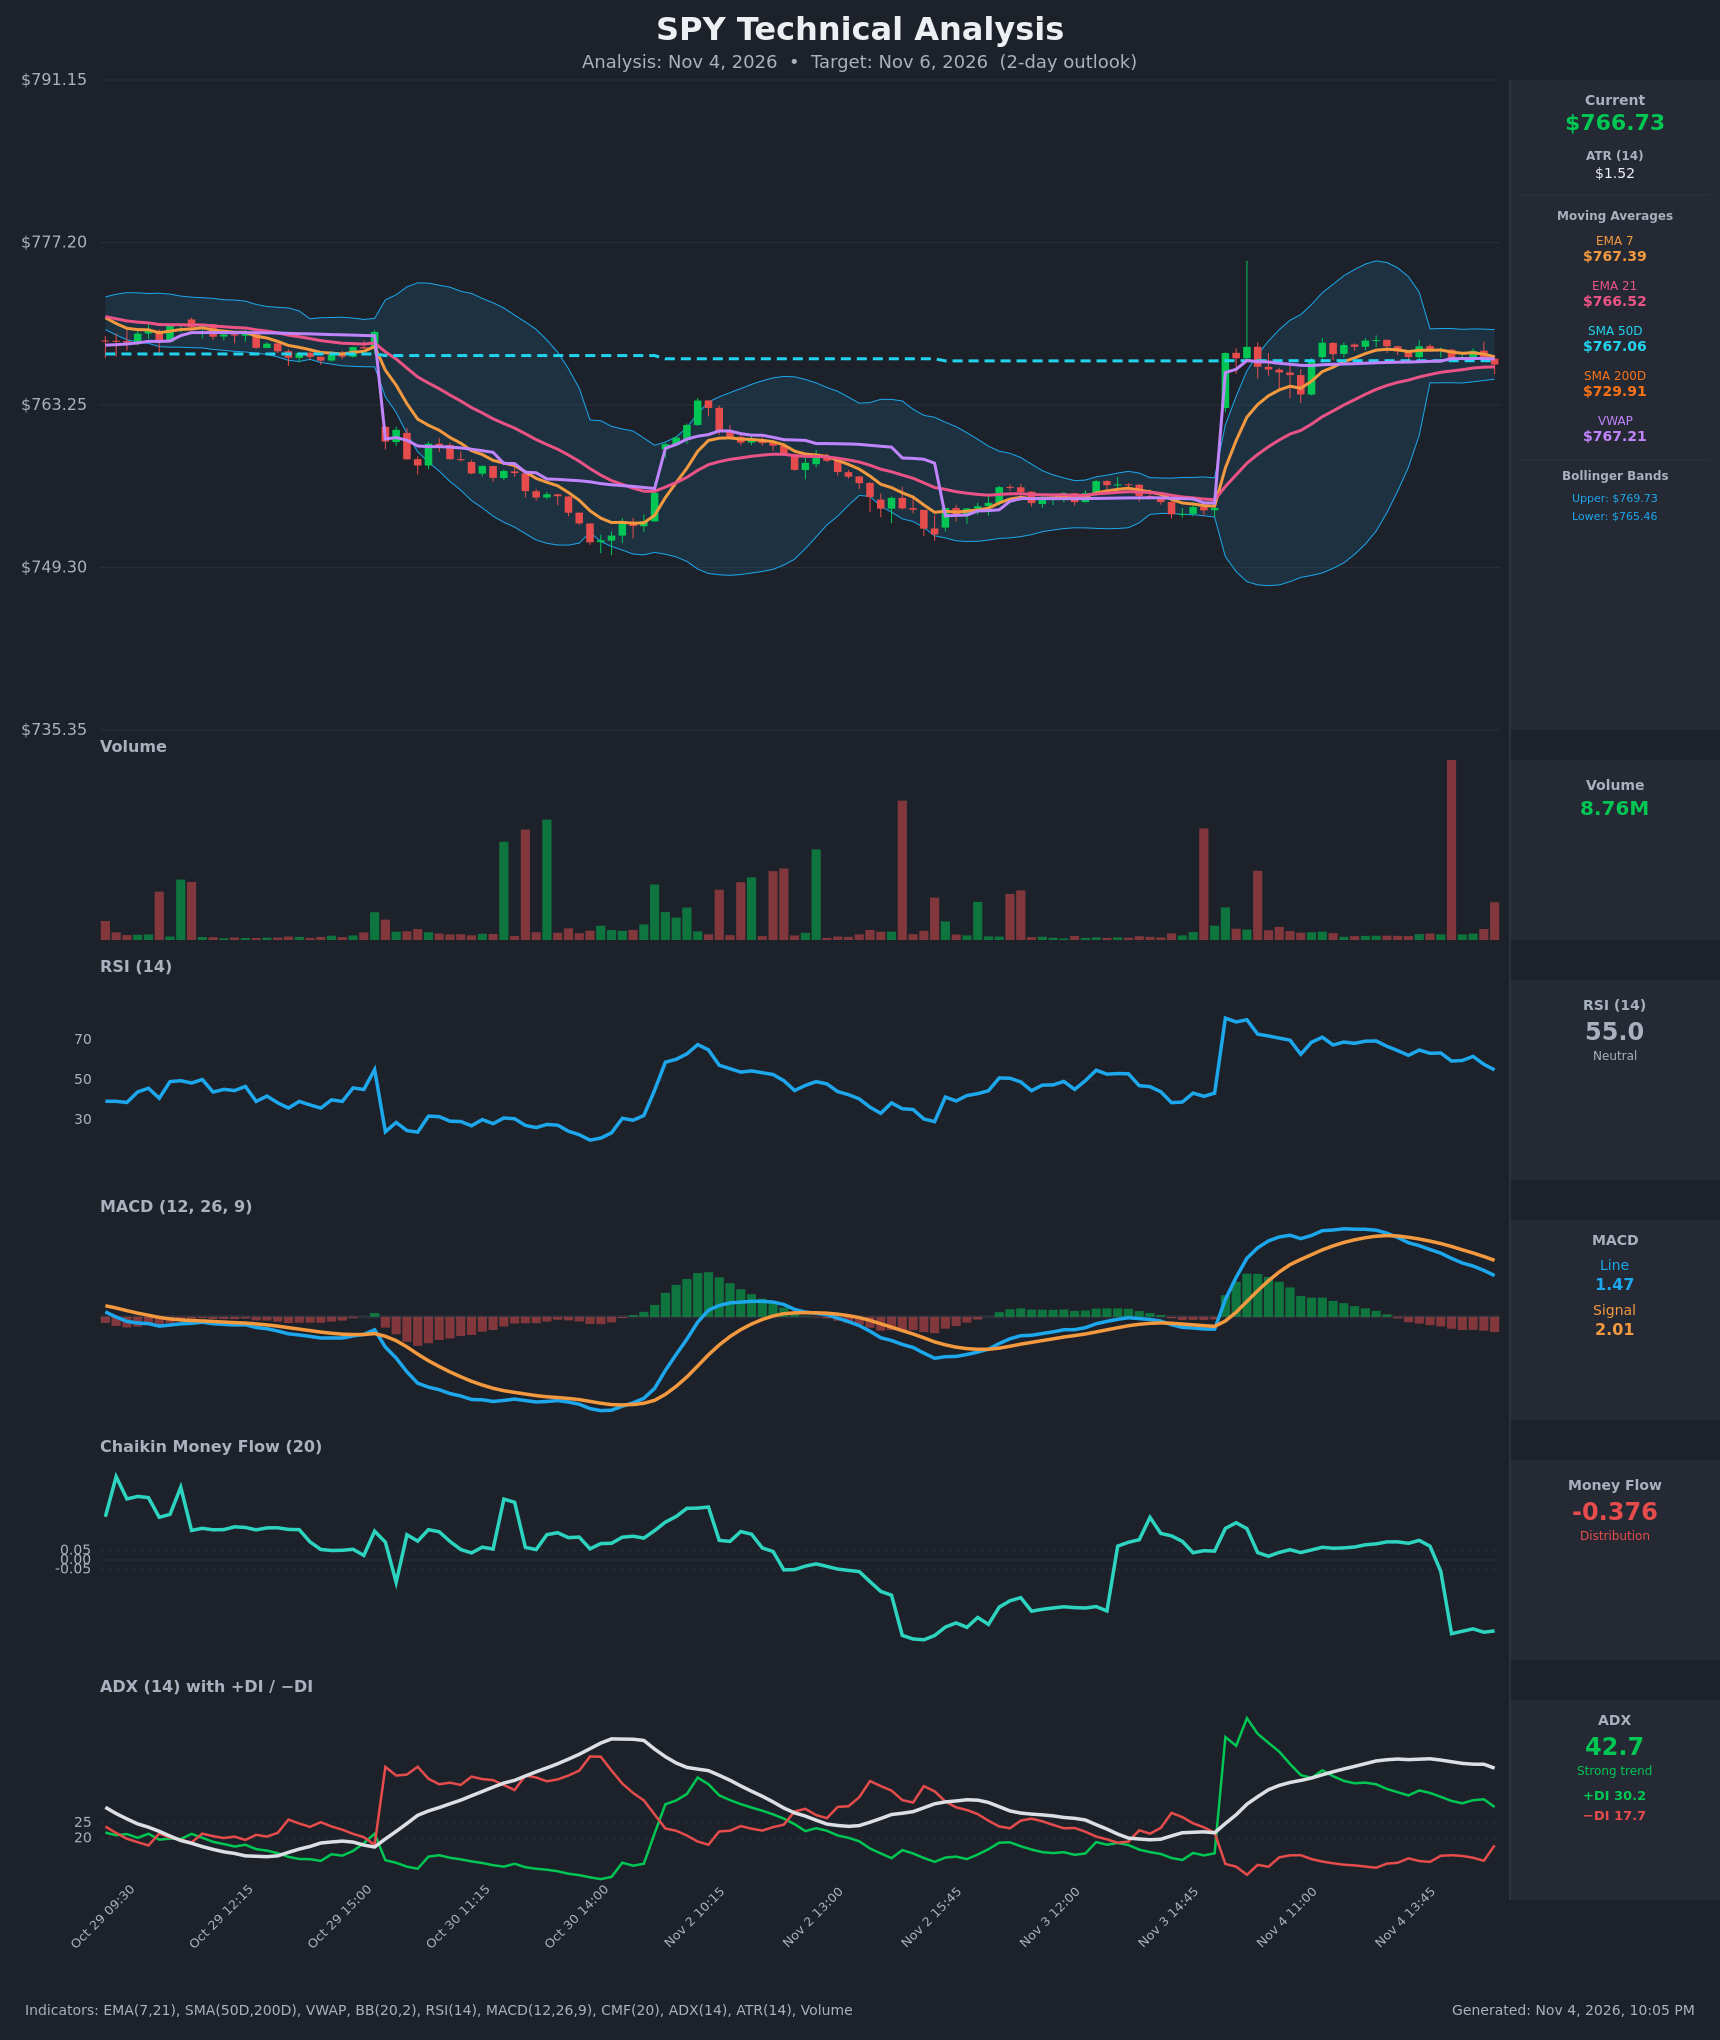
- RSI (14): 55.02, down sharply from about 69.5 at 13:00 and now close to the midline. Momentum has faded steadily over the last two hours, and the trend of lower RSI highs is intact. [Neutral]
- 20 EMA: The data gives EMA 7 at $767.39 and EMA 21 at $766.52. Price ($766.73) is below EMA 7 and only $0.21 above EMA 21. EMA 7 is still above EMA 21, but the gap has narrowed from about $3.7 to $0.9. A bearish crossover is close, and EMA 21 at about $766.52 is the last short-term support. [Neutral]
- MACD: Line 1.47 is below Signal 2.01, and the histogram is negative at about -0.54. The bearish crossover happened around 13:30 and the spread keeps widening. The chart shows the line rolling over from the post-gap peak. [Bearish]
- Bollinger Bands (20): Upper $769.73, lower $765.46, midline about $767.6. Price is in the lower half of the bands and below the midline. The bands have contracted sharply after the gap-up expansion, which points to compression and a coming directional move. Price is about $1.27 above the lower band. [Bearish]
- CMF (20): -0.376, well below -0.05. It collapsed from +0.10 to about -0.39 in two bars (14:30-14:45) after a very large volume spike and has stayed there. That is a clear sign of distribution into the highs. [Distribution]
- ADX (14): 42.7, strong but turning down from a 45.8 peak. +DI is 30.2 and −DI is 17.7, so +DI is still on top. +DI has fallen from about 38 and −DI has risen from about 10, so the trend is losing steam. The strong ADX comes from the Nov 3 to Nov 4 gap-up rally, not from current price action. [Strong Trend, bullish but weakening]
- Volume: 8.76M on the latest bar, after a huge spike (the tallest bar on the chart) around 14:30 that coincided with the CMF drop and a stall in price. Volume is otherwise light during the consolidation. A heavy spike with no price progress suggests distribution. [Bearish / distribution]
DIVERGENCES & TRENDS
- Price vs. momentum: Price has held a tight $767-769 range since mid-session, while RSI fell from about 69 to 55 and MACD fell from 3.14 to 1.47. This is a mild bearish divergence, with momentum eroding while price holds up.
- CMF vs. price: CMF is deeply negative while price sits near the session highs. This is a bearish divergence, because volume flow is not confirming the price level.
- ADX/DI: The spread between +DI and −DI has narrowed from about 27 points to 12.5. −DI jumped from 12.7 to 17.7 on the final bar.
- Crossovers and breaks: MACD has crossed bearish. Price has dropped below EMA 7, VWAP ($767.21) and SMA50D ($767.06). EMA 7 and EMA 21 are converging. Price is far above SMA200D ($729.91), so the long-term uptrend is intact, though SMA200D is too far away to be near-term support. The Nov 3 gap-up (from about $757 to about $766) remains unfilled.
CHART PATTERNS
- Consolidation after gap-up (Bullish Pennant / Symmetrical Triangle): After the Nov 3 gap-up, price has been coiling in a narrowing range of about $766-769, with Bollinger Band compression. Classically, a pennant after a sharp advance resolves upward, with a measured move equal to the pole. Here the confirming indicators are leaning the other way.
- Bearish alternative (Bearish Pennant/Flag-like rollover): Lower highs ($768.84 to $767.90), a bearish MACD cross, and distribution in CMF suggest the pattern may fail to the downside. The first breakdown trigger is a close below $765.46 (lower BB, the pattern's lower boundary). The measured downside target is the gap-fill area of $757-760, but over two days a partial move toward $762-764 is more realistic.
- No clear reversal pattern such as a head and shoulders or a double top is completed.
POTENTIAL SCENARIOS
- Scenario 1: Bearish Distribution Drift Lower — Fading momentum, a negative MACD cross, and heavy distribution (CMF -0.38) push price below EMA 21 and the lower Bollinger Band as the compression resolves downward. Trigger: sustained break below $765.46. Target: $762.00-$764.50, with an extension toward $759 if the gap starts to fill. Invalidation: a reclaim of VWAP/EMA 7 above $767.40 and then $769.73. (50% probability)
- Scenario 2: Neutral Range Continuation — Price keeps chopping between the lower band and the VWAP/SMA50 cluster while the bands stay compressed and the indicators reset. Trigger: closes holding between $765.50 and $768.50. Target: $766-$768. Invalidation: a decisive close outside $765.00-$769.80. (22% probability)
- Scenario 3: Bullish Pennant Breakout — The strong ADX trend (+DI over −DI) reasserts itself and price breaks the upper boundary of the consolidation, in line with the gap-up trend. Trigger: close above $769.73 on rising volume with MACD turning back up. Target: $772-$775. Invalidation: a fall back below $766.50 (EMA 21). (28% probability)
PRICE TARGETS
- Target Price: $764.50 (by Nov 6, 2026 close, 2 days out)
- Expected Range: $757.00 to $773.00 (width $16.00, about 2.1% of the current price, scaled for a 2-day horizon)
- Key Levels: Support at $765.46 (lower Bollinger Band, then the $757-760 gap zone), Resistance at $769.73 (upper Bollinger Band)
OVERALL BIAS
OVERALL BIAS: BEARISH - Price is below EMA 7, VWAP and SMA50D, with a bearish MACD cross, falling RSI, and strongly negative CMF (-0.376) on a heavy volume spike. A drift toward $764.50 and possible gap-fill pressure is the most likely outcome. The strong ADX with +DI on top and the distant SMA200D keep the long-term trend bullish, so conviction is moderate.
This is educational analysis and not financial advice.