DELL 43-day bearish forecast — Nov 5, 2026
- Bias: Bearish
- Timeframe: 43 days (made Nov 5, 2026, target date Dec 18, 2026)
- Price at analysis: $346.90
- Price target: $332.00
- Expected range: $305.00 – $362.00
- Result: Pending — graded after the close on Dec 18, 2026
Get a free AI analysis of DELL today
Analysis
TECHNICAL INDICATORS
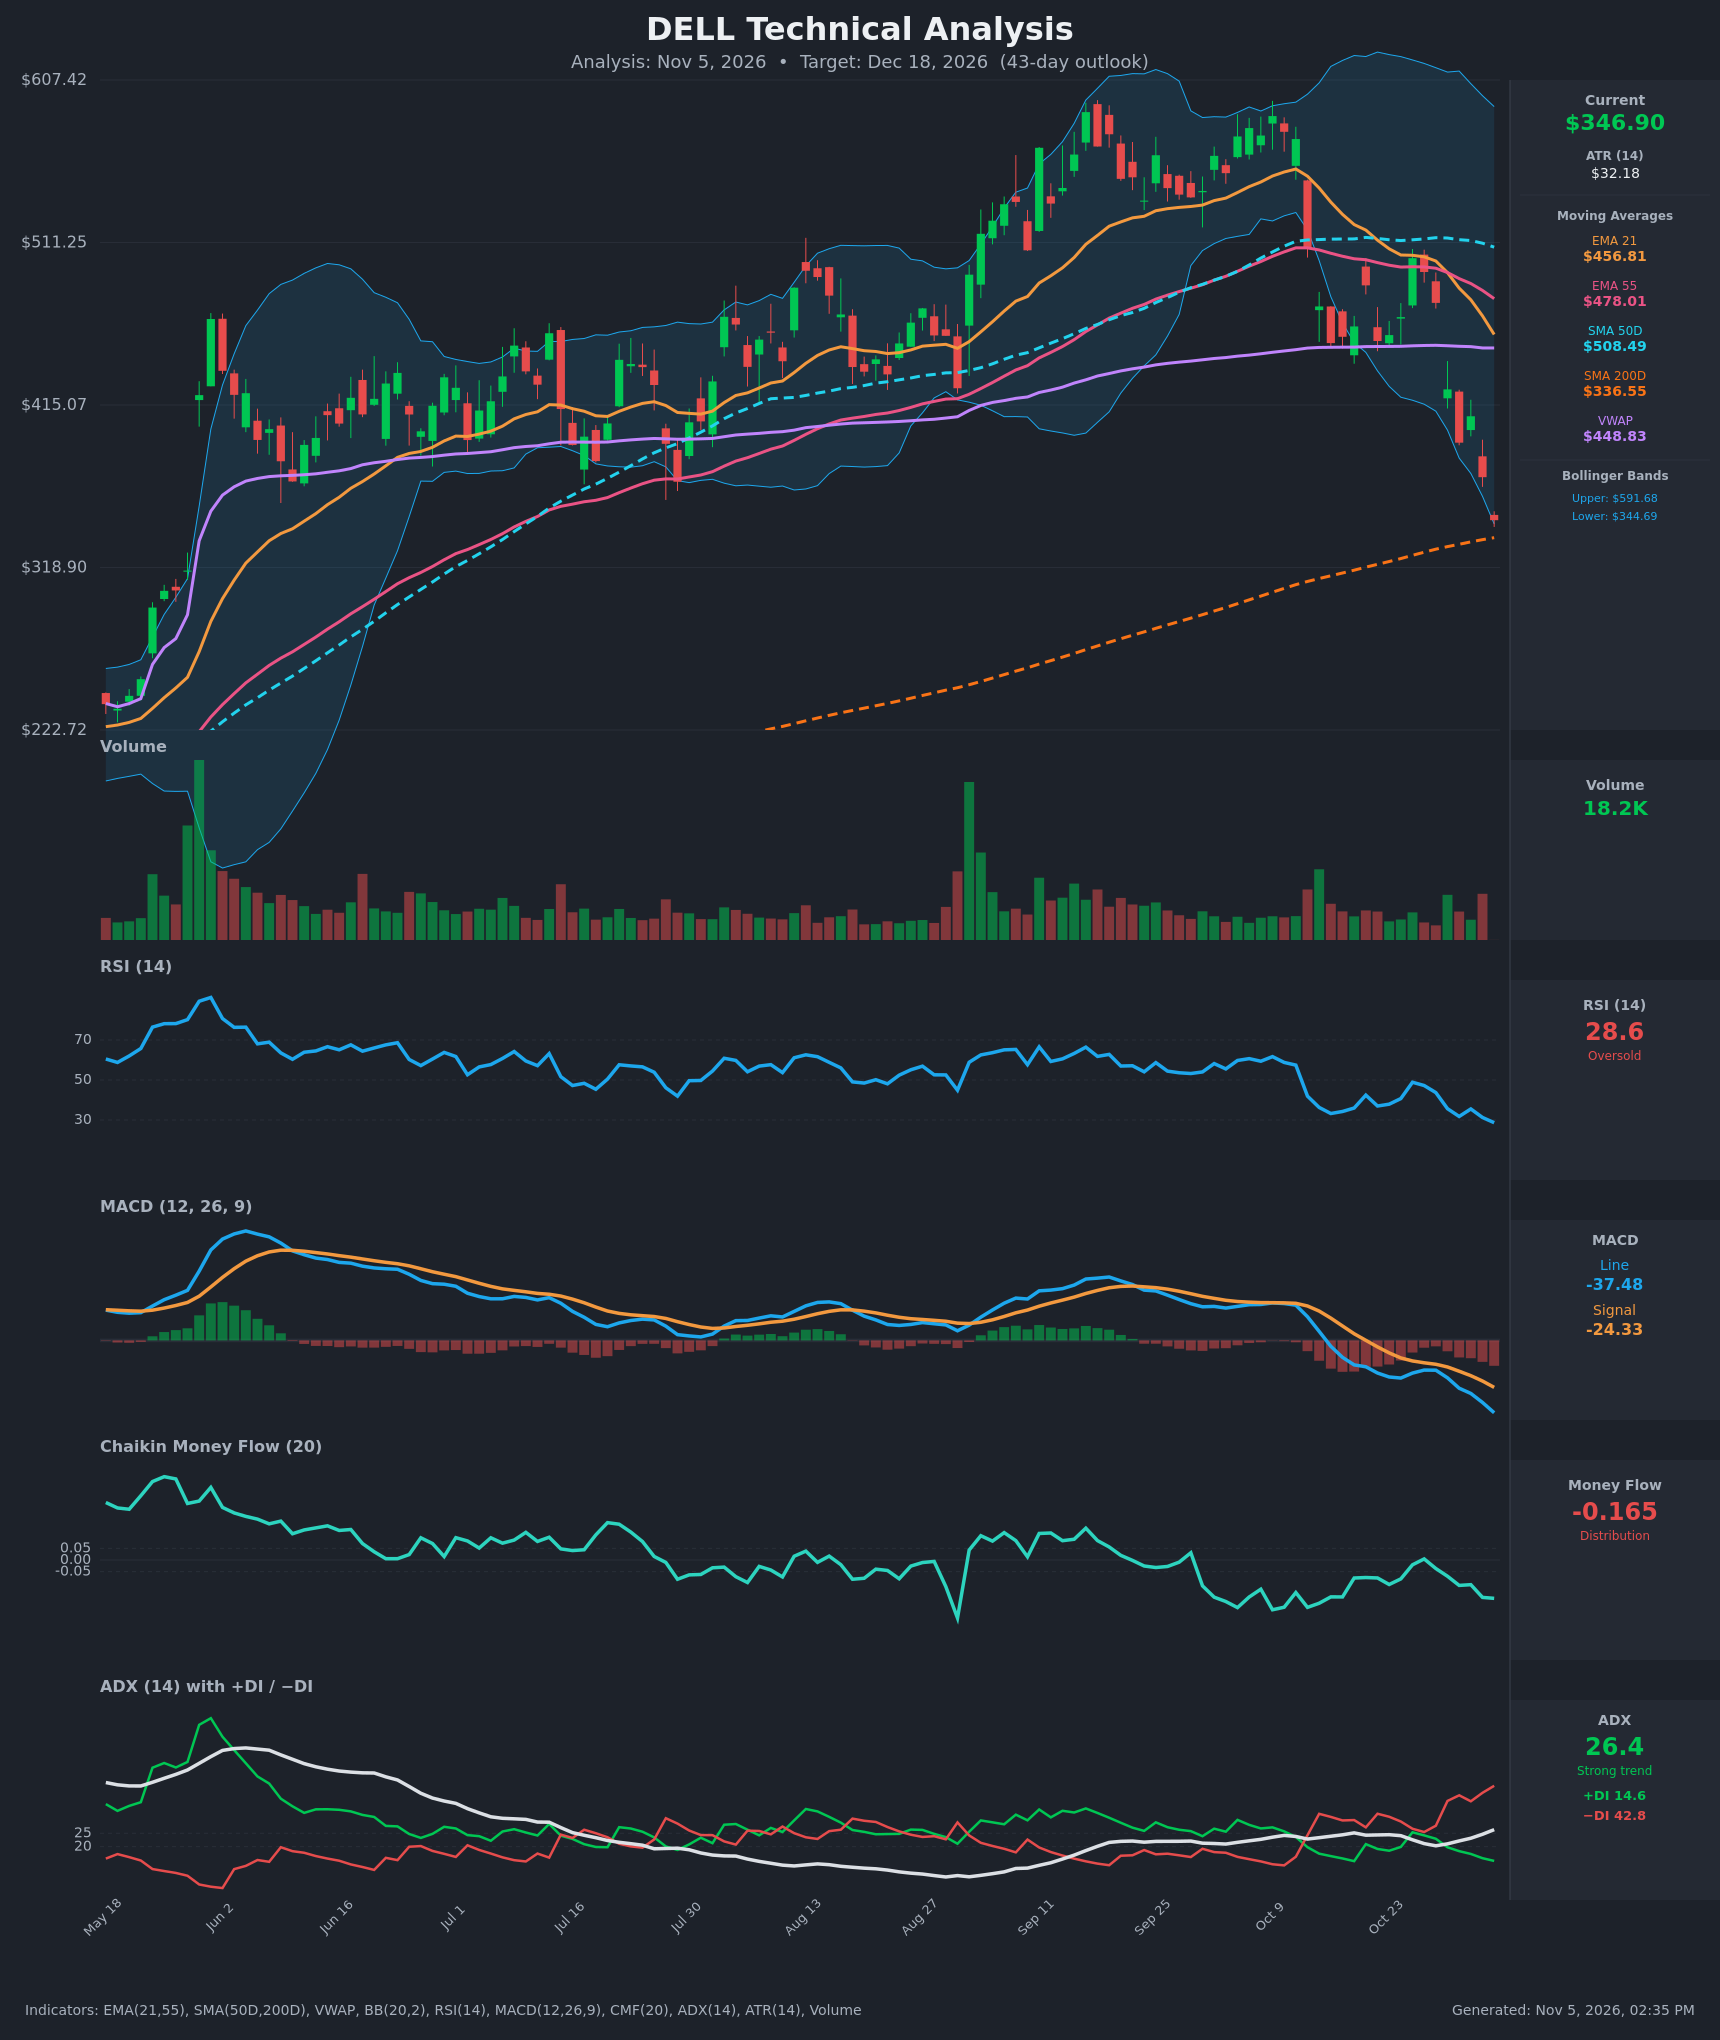
- RSI (14): 28.64, in oversold territory. It has fallen from about 60 in early October to under 30 in a steady slide, with no bullish divergence yet. Oversold conditions can persist in a strong downtrend. [Bearish]
- 20 EMA (EMA 21 = $456.81): Price at $346.90 is about 24% below it, and the EMA is sloping down steeply. It is now dynamic resistance. EMA21 crossed below EMA55 ($478.01) around Oct 30, a bearish crossover. [Bearish]
- MACD: The line (-37.48) is below the signal (-24.33), with a bearish crossover around Oct 21-22. The negative histogram (about -13) keeps widening and both lines are accelerating lower, so momentum is still deteriorating. [Bearish]
- Bollinger Bands (20): Price is at the lower band ($344.69), with the upper band at $591.68. The bands are wide, which shows high volatility. Price has been walking the lower band after the breakdown. A band tag is a stretched condition but not a reversal signal by itself. [Bearish]
- CMF (20): -0.165, well below -0.05. It has been mostly negative since mid-September and is making new lows, which shows persistent distribution. [Distribution]
- ADX (14): 26.4 and rising, so this is a strong trend. −DI (42.8) is far above +DI (14.6), and the gap is widening, so bears are firmly in control. [Strong Trend – Bearish]
- Volume: 18.2K, modest. There is no capitulation volume spike on the recent drop, so the selling does not look exhausted. Down days in late October and early November carried slightly heavier volume than the bounces. [Mildly Bearish]
Moving average and VWAP context:
- Price is below EMA21, EMA55, SMA50D ($508.49) and VWAP ($448.83).
- Price sits just above SMA200D ($336.55), which is the last major support. SMA50D is still above SMA200D, so there is no death cross yet, though the gap is narrowing.
DIVERGENCES & TRENDS
- No bullish divergence: RSI, MACD and CMF all made new lows alongside price.
- The September peak (about $590) was followed by a lower high in October (about $575). RSI and CMF also made lower highs, a mild bearish divergence that preceded the breakdown.
- The Oct 9 gap down broke below EMA21, EMA55 and VWAP. Price then failed to hold the rebound near $500 on Oct 27-28 and rolled over.
- Price fell from about $502 to $347 in under two weeks, a roughly 31% decline, and −DI and ADX are rising together.
- Price is 3% above SMA200D and at the lower Bollinger Band. This is the main reason a relief bounce is possible.
CHART PATTERNS
- Bearish Double Top (reversal): Peaks at about $590 (Sept) and about $575 (Oct) have a neckline near $440-455. Price broke it decisively on the Oct 9 gap and the Oct 30 drop. The measured move is the pattern height (about $130-140) subtracted from the neckline, which gives roughly $310-325. That is below the SMA200D and would be a test of it.
- Failed retest: The Oct 27-28 rebound to about $500 was rejected at the SMA50D and EMA21 zone, which confirms the broken support as resistance.
- Price is near the lower band and SMA200D, so a bounce or a base could form there. Nothing like a Double Bottom or Falling Wedge is visible yet.
POTENTIAL SCENARIOS
- Scenario 1: Bearish SMA200D Breakdown and Measured-Move Extension — Price loses the SMA200D (~$336) on a closing basis and follows the double-top measured move. −DI stays dominant and MACD keeps falling. Trigger: daily close below $336.55 with CMF staying below -0.10. Target: $305-$320, with a possible overshoot toward $290. Invalidation: daily close above $408. (50% probability)
- Scenario 2: Bullish Oversold Relief Bounce — The SMA200D holds, RSI turns up from sub-30 and price mean-reverts toward the broken support. Trigger: RSI back above 35 with a bullish candle and volume expansion, then a close above $372. Target: $395-$410, with possible extension toward $430-$457 (EMA21). Invalidation: close below $330. (35% probability)
- Scenario 3: Neutral Base Around the 200-Day — Price chops between about $320 and $385 while the indicators reset. Trigger: ADX falls below 22 and price holds above SMA200D. Target: $340-$370. Invalidation: close outside the $315-$395 range. (15% probability)
PRICE TARGETS
- Target Price: $332.00 (43-day horizon, about 4% below current)
- Expected Range: $305.00 to $362.00 (width $57, or about 16.4% of price, in line with the 30-60 day guidance)
- Key Levels: Support at $336.55 (SMA200D), with the next support at $305.00. Resistance at $408.40 (Nov 3 close and recent swing), with further resistance at $456.81 (EMA21).
OVERALL BIAS
OVERALL BIAS: BEARISH - Every trend and momentum indicator (MACD, ADX/DI, CMF, and price below all key averages) points down, and the double-top breakdown has a measured target near $320. The oversold RSI and the nearby SMA200D argue for a bounce, but there is no capitulation volume or bullish divergence yet, so the weight of evidence still favors lower prices.
This is educational analysis and not financial advice.