SPY 43-day bearish forecast — Nov 6, 2026
- Bias: Bearish
- Timeframe: 43 days (made Nov 6, 2026, target date Dec 18, 2026)
- Price at analysis: $733.00
- Price target: $722.00
- Expected range: $672.00 – $772.00
- Result: Pending — graded after the close on Dec 18, 2026
Get a free AI analysis of SPY today
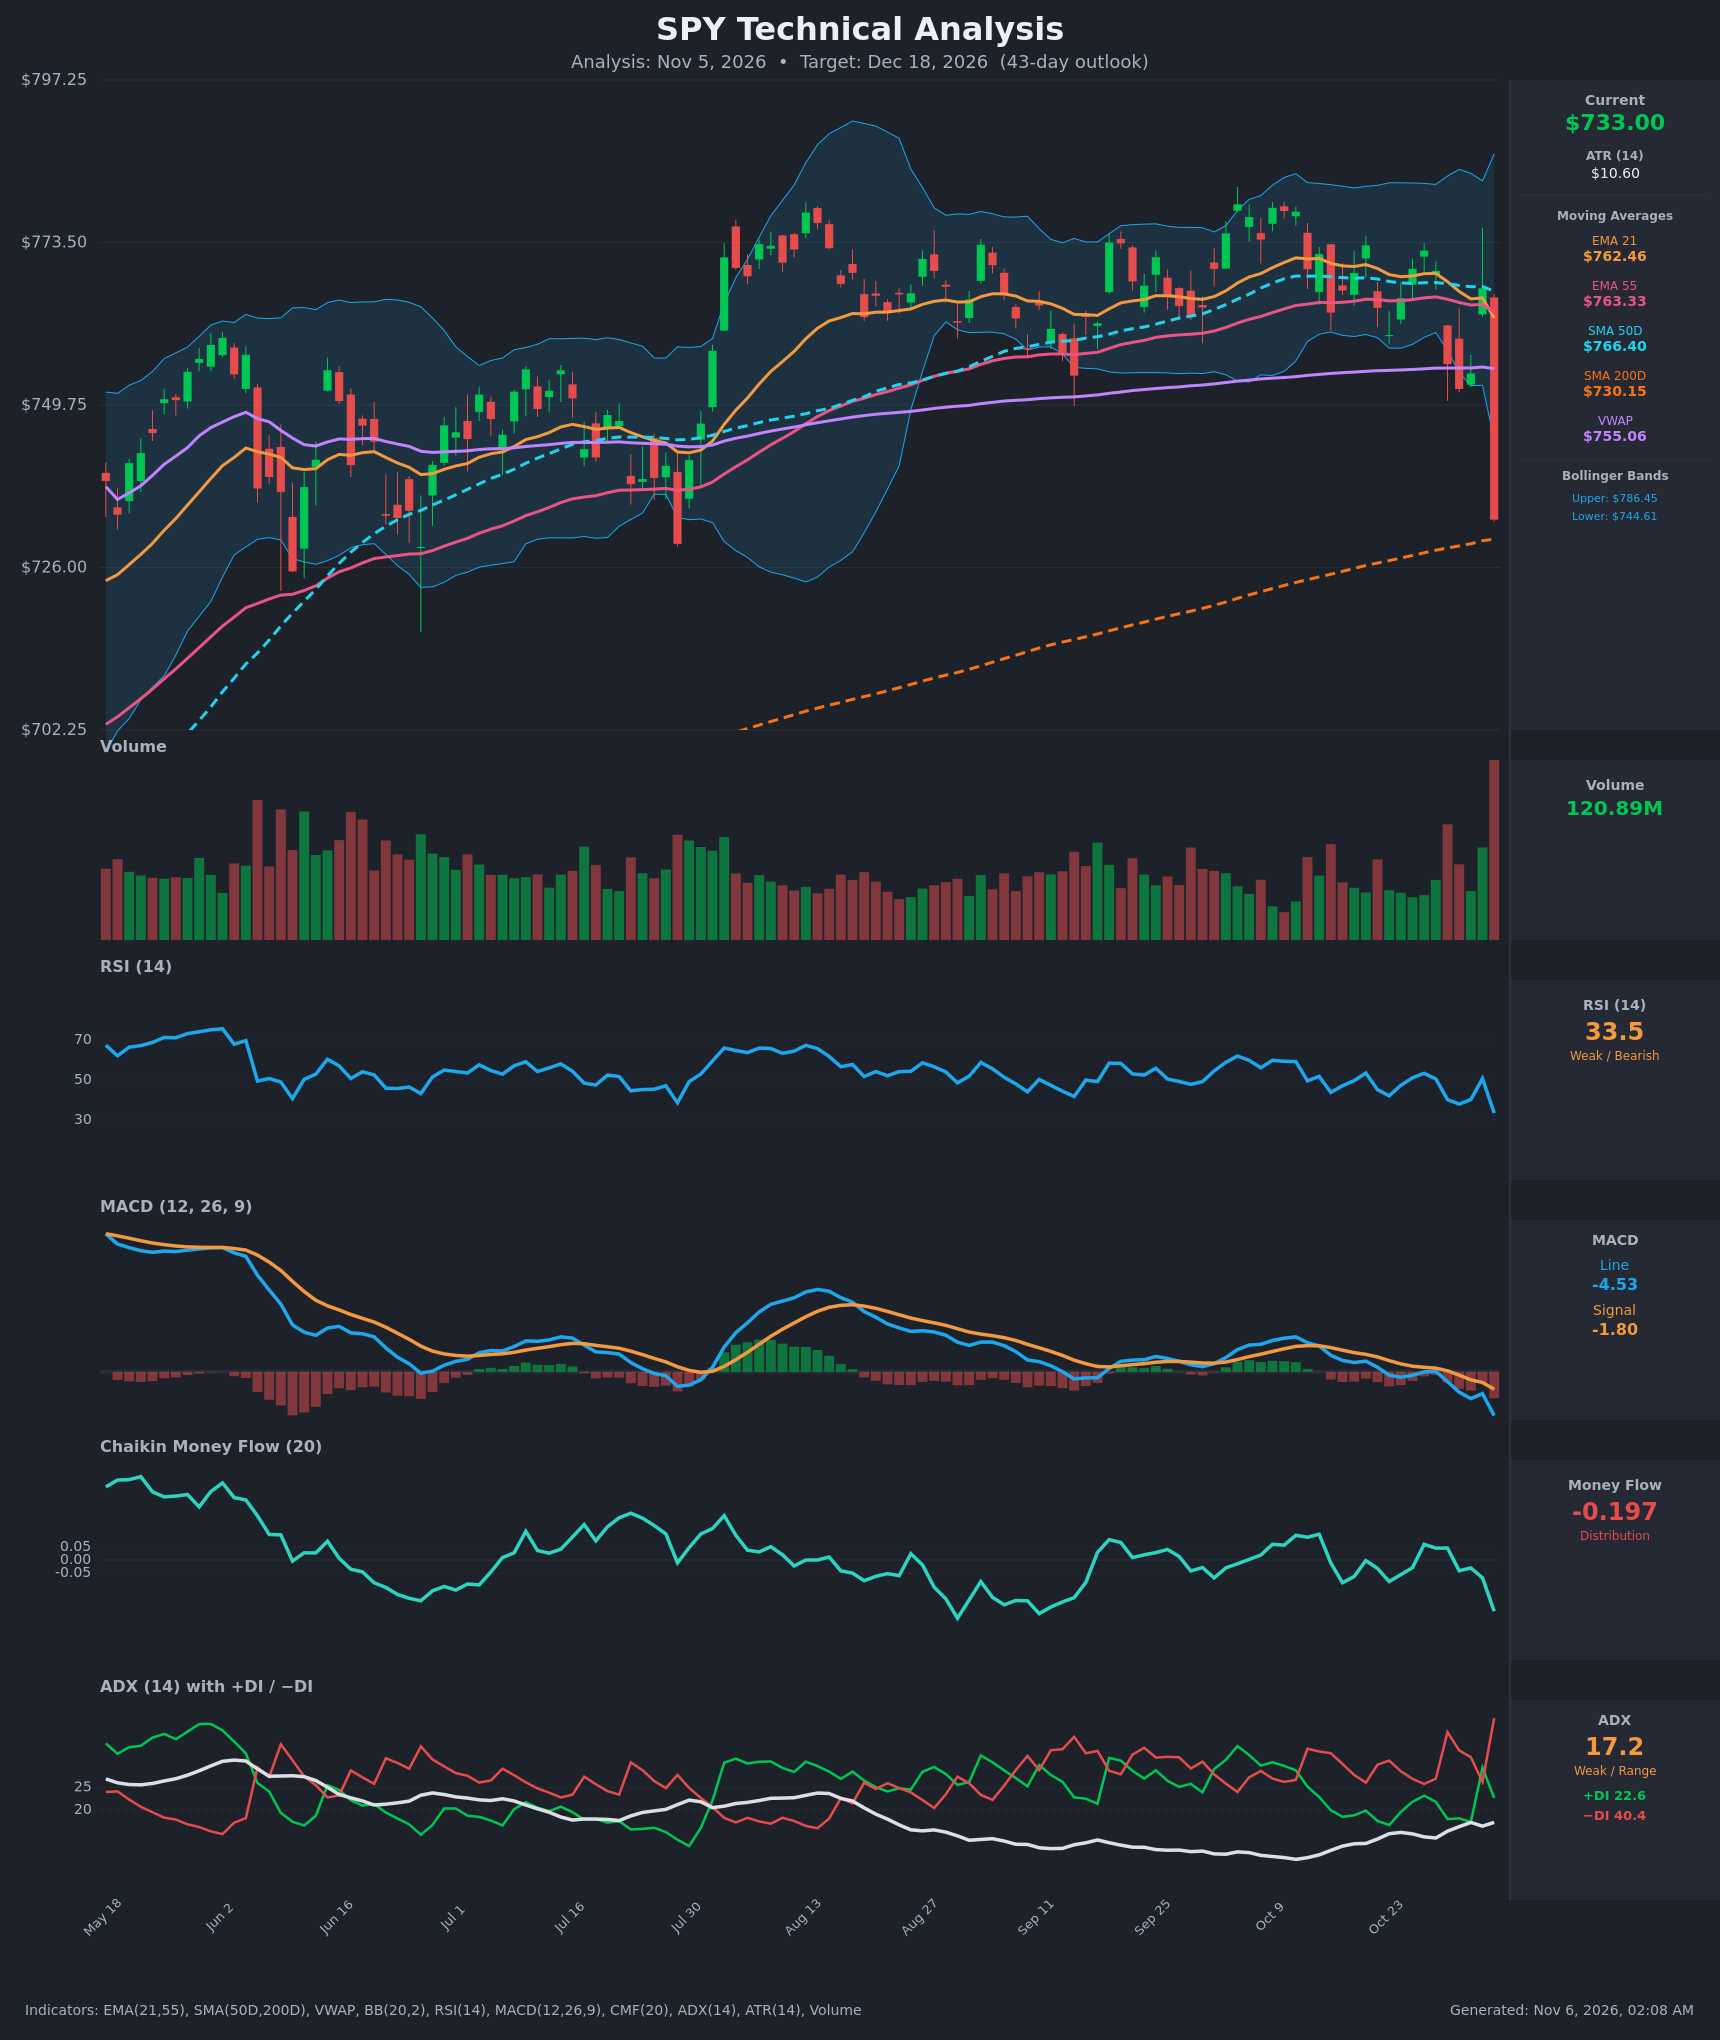
Analysis
TECHNICAL INDICATORS
- RSI (14): 33.5, down sharply from 50.7 the day before and approaching the 30 oversold line. Momentum is clearly negative, but it has not yet reached an oversold extreme. [Bearish]
- 20 EMA (EMA 21 = $762.46): Price at $733.00 is about 3.9% below it, so it acts as overhead resistance. EMA 21 also crossed below EMA 55 ($763.33) on Nov 5, a fresh bearish crossover. [Bearish]
- MACD: Line -4.53 is below signal -1.80, with a widening negative histogram of about -2.7. The bearish crossover occurred around Oct 30 and has since accelerated to the lowest MACD reading in the visible window. [Bearish]
- Bollinger Bands (20): Price closed well below the lower band ($744.61), with the middle band near $765.5 and the upper band at $786.45. This is a statistically stretched move that raises the odds of a bounce, but it also signals a volatility expansion and breakdown from a tight range. [Bearish]
- CMF (20): -0.197, the lowest reading in the visible period and well below -0.05. This shows heavy distribution after the recent drop. [Distribution]
- ADX (14): 17.2 (weak but ticking up) with -DI 40.4 far above +DI 22.6. The trend is not yet established, but the directional pressure is strongly with the bears. [Weak Trend, Bearish Direction]
- Volume: 120.89M, the largest bar in the whole visible window, on a roughly -4.4% red candle. This is a high-volume breakdown or capitulation-style distribution day. [Bearish, high-conviction selling]
Other context:
- Price is below VWAP ($755.06), EMA 21, EMA 55 and SMA 50D ($766.40).
- Price sits just above SMA 200D ($730.15), the last major long-term support.
- There is no death cross, since SMA 50D is still well above SMA 200D.
DIVERGENCES & TRENDS
- No bullish divergence yet. RSI and MACD are making new lows in step with price, so momentum confirms the decline.
- MACD has fallen from near zero to -4.53 in about 5 sessions, and the histogram is expanding negatively.
- CMF has trended down from the Oct 28 high of +0.06 to -0.197, which confirms distribution.
- DI spread: -DI jumped from 26 to 40 in two sessions. ADX is rising off its lows but is still below 20, so the trend is early-stage.
- Moving averages: EMA 21 crossed below EMA 55, and price lost EMA 21, EMA 55, SMA 50D and VWAP in a single session.
- Range break: Price had been oscillating in a tight $752–$773 band for about 6 weeks. The Nov 5 close broke decisively below that band.
CHART PATTERNS
- Bearish Triple Top / range breakdown: The Aug–Oct consolidation had repeated rejections near $770–$775 and a floor near $750–$752. The Nov 5 break below that floor on record volume resembles a rectangle or triple-top breakdown. The measured move is the range height of about $22, projected from ~$752, which gives a target near $730. That is almost exactly the SMA 200D.
- Possible Bearish Head and Shoulders character: The Jul–Oct highs formed lower or equal peaks after the Aug high near $780. The neckline sits near $750 and has been broken.
- Counter-signal: Price is stretched below the lower Bollinger Band and is touching the SMA 200D zone. A short-term relief bounce, or a retest of the broken $750–$755 area from below, is likely before any continuation lower.
POTENTIAL SCENARIOS
- Scenario 1: Bearish Breakdown Continuation — Distribution on record volume, a bearish MACD and DI structure, and a broken range lead to a loss of the SMA 200D. A weak bounce fails at the broken range and VWAP, then sellers push toward the next support. Trigger: daily close below $730.15 (SMA 200D). Target: $700–$710, with an extension to $685. Invalidation: daily close back above $755 (VWAP and broken range floor). (47% probability)
- Scenario 2: Bullish Mean-Reversion Rebound — The oversold-ish RSI, price below the lower Bollinger Band and support at the SMA 200D trigger a snap-back rally. Trigger: reclaim of $745 (lower band) with CMF turning up. Target: $755–$765 (VWAP, then EMA 21/55 cluster). Invalidation: close below $725. (33% probability)
- Scenario 3: Neutral Choppy Base at the 200D — Price oscillates around the SMA 200D as sellers exhaust and buyers cannot reclaim the range. Trigger: closes holding $715–$748 for several weeks. Target: ~$730. Invalidation: close above $755 or below $705. (20% probability)
PRICE TARGETS
- Target Price: $722.00 (43-day, Dec 18, 2026)
- Expected Range: $672.00 to $772.00 (width $100, about 13.6% of the current price; consistent with the 30–60 day guidance and roughly 1 sigma of ATR scaled over 43 days)
- Key Levels: Support at $730.15 (SMA 200D), Resistance at $755.06 (VWAP and broken range floor)
OVERALL BIAS
OVERALL BIAS: BEARISH - A high-volume breakdown from a 6-week range, a bearish MACD and EMA crossover, -DI dominance, deeply negative CMF and price below every key average except the SMA 200D favor further downside. A relief bounce is possible given the stretched Bollinger reading, but rallies into $755–$765 are likely to meet supply.
This is educational analysis and not financial advice.