SPY 85-day bearish forecast — Nov 6, 2026
- Bias: Bearish
- Timeframe: 85 days (made Nov 6, 2026, target date Jan 29, 2027)
- Price at analysis: $733.00
- Price target: $718.00
- Expected range: $652.00 – $788.00
- Result: Pending — graded after the close on Jan 29, 2027
Get a free AI analysis of SPY today
Analysis
TECHNICAL INDICATORS
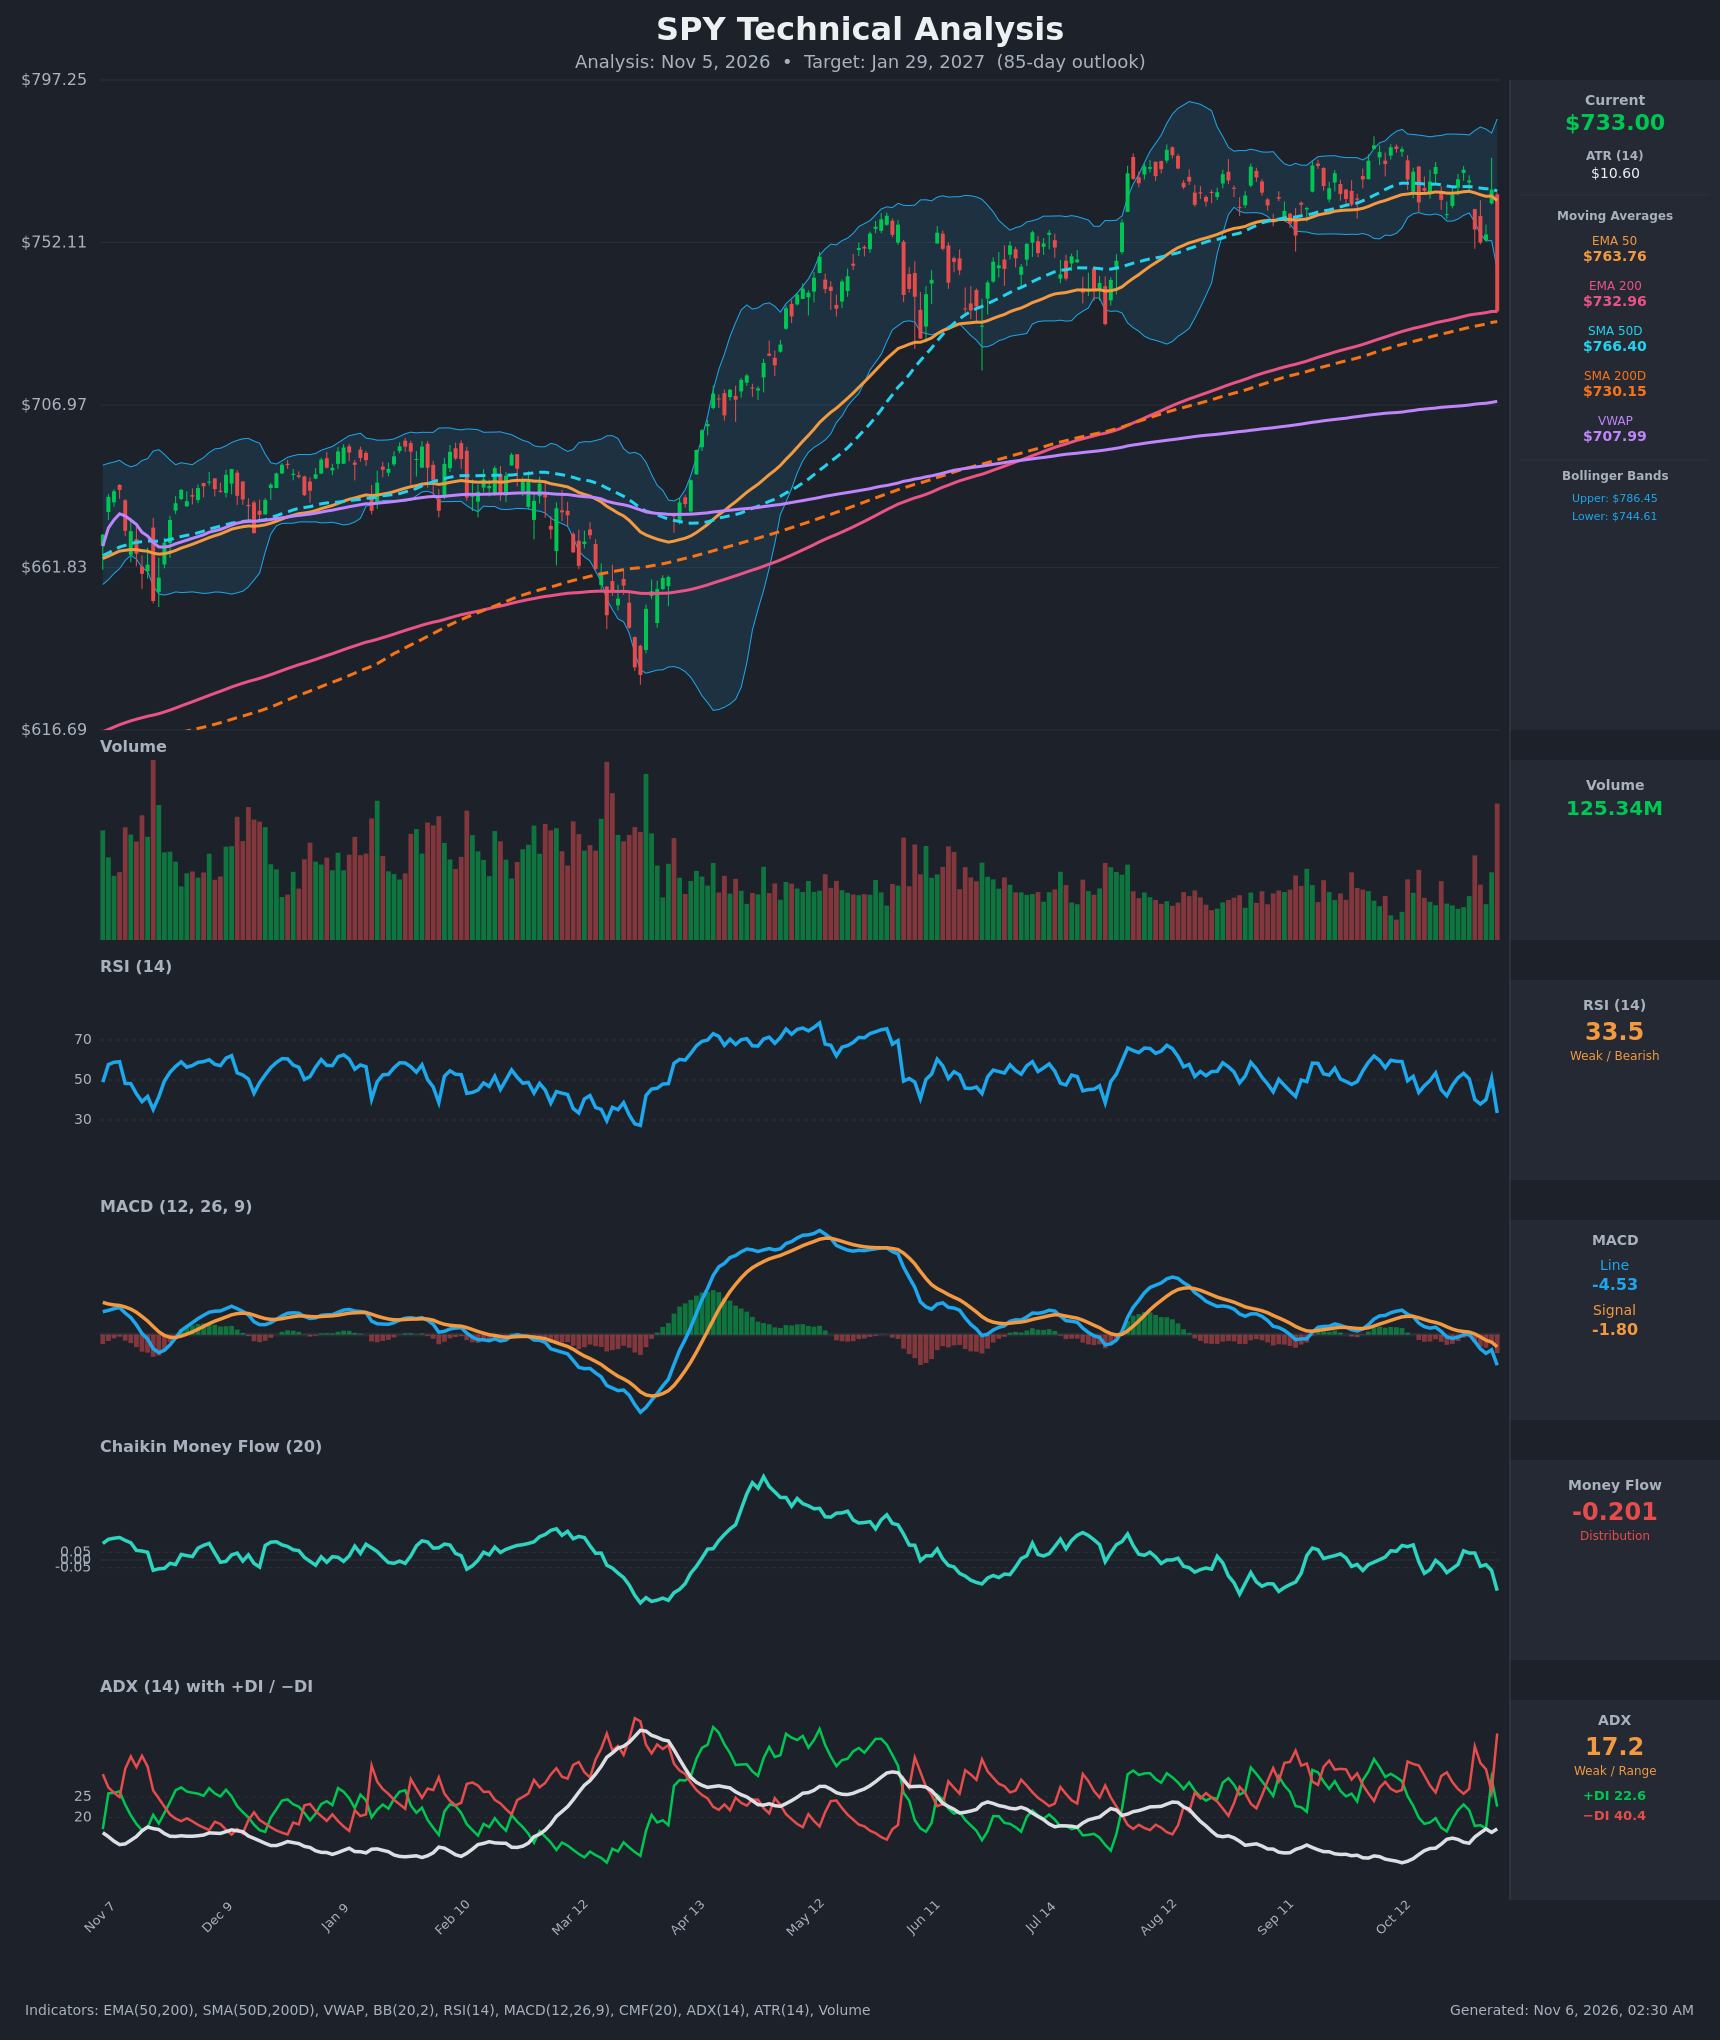
- RSI (14): 33.5, down sharply from 50.7 a day earlier and near the oversold line at 30. It has made lower highs since the October peak of about 53. Momentum is clearly bearish, though a reading this close to 30 raises the chance of a short-term bounce. [Bearish]
- 20 EMA: Not supplied. The EMA 50 at $763.76 and SMA 50D at $766.40 sit about 4.2% above price and act as overhead resistance. Price has just lost both. The EMA 200 ($732.96) and SMA 200D ($730.15) are right at current price and form the last major support layer. [Bearish]
- MACD: Line at -4.53 and signal at -1.80, so the line is below the signal with a widening negative histogram. The bearish crossover happened around Oct 30 and has since accelerated, and the line is at its lowest in months. [Bearish]
- Bollinger Bands (20): Price of $733 is well below the lower band ($744.61) after a roughly 4.4% one-day drop, and the bands are wide (upper $786.45). A close outside the lower band shows a volatility expansion to the downside. It can also mark short-term exhaustion and bring a mean-reversion bounce toward the $764 mid-band. [Bearish]
- CMF (20): -0.201, well beyond the -0.05 threshold and the weakest reading in months. It has been drifting negative or flat for weeks, and the latest drop confirms heavy distribution. [Distribution]
- ADX (14): 17.2 with −DI at 40.4 on top of +DI at 22.6. ADX is below 20, so there is no established trend yet. The wide DI spread and the jump in −DI show sellers taking control, and ADX would need to rise above 25 to confirm a new downtrend. [Weak Trend, Bearish Direction]
- Volume: 125.34M on the final bar, the largest volume spike in months, on a large red candle. Heavy volume on a breakdown day signals real selling and not a low-conviction dip. It could also be a capitulation-style bar if the 200-day average holds. [Bearish]
DIVERGENCES & TRENDS
- No bullish divergence yet. Price, RSI, MACD and CMF all made fresh lows together, so momentum confirms the price move.
- Fading trend strength since the spring rally. The RSI peak near 75 in May was followed by weaker readings of about 65 in August and about 62 in October. Price made higher highs into the $775–$785 area, while MACD and CMF peaked lower. This is a mild bearish divergence that has now resolved to the downside.
- MACD crossed bearishly on Oct 30 and the gap has widened. The line is now at its lowest since the March low.
- CMF has trended down from positive readings in the summer to -0.201.
- DI: −DI has been above +DI for most of the last 15 bars, widening to 40.4 vs 22.6 on the breakdown day.
- Moving averages: EMA 50 and SMA 50D are rolling over, while EMA 200 and SMA 200D are still rising. Price sits right on the 200-day pair. The 50/200 averages remain in a bullish configuration, so there is no death cross yet, but the gap is narrowing to about $33 and price is testing the long-term support.
- VWAP: Price remains above the anchored VWAP at $707.99, which is the next support, about 3.4% lower.
CHART PATTERNS
- Bearish Triple Top / range breakdown: Since August, price has repeatedly failed near $775–$785 and has held a $745–$785 trading range. The lower boundary near $745 has now been broken on heavy volume. The range height of about $35–$40 projects a measured move to roughly $705–$715.
- Bearish Rising Wedge / Head and Shoulders elements: The Aug–Oct highs were flat to lower while the lows were being defended, which fits a distribution structure. The breakdown below the neckline area confirms the reversal bias.
- Counterpoint: The decline stops exactly at the 200-day EMA/SMA, so a bounce or retest of the broken $745–$764 zone is plausible before any further downside. That would be a classic retest of broken support.
POTENTIAL SCENARIOS
- Scenario 1: Bearish Range Breakdown Continuation — A confirmed loss of the 200-day cluster ($730–$733) with weak bounces that fail below $745–$764 would complete the triple-top / range breakdown and send price toward VWAP and the measured-move zone. Trigger: daily close below $730 with −DI staying above 35 and ADX rising above 20–25. Target: $708 (VWAP), then $685–$700. Invalidation: daily close back above $766 (EMA 50/SMA 50D). (50% probability)
- Scenario 2: Bullish 200-Day Support Bounce — Oversold RSI, price outside the lower Bollinger Band and a stand at the 200-day averages trigger a rebound, with the high-volume bar acting as capitulation. Trigger: reclaim of $745 (lower band) followed by a close above the $764 EMA 50. Target: $764–$785. Invalidation: close below $725. (32% probability)
- Scenario 3: Neutral Choppy Base Around the 200-Day — Price oscillates between $710 and $765 as sellers and buyers trade off. Trigger: failure to break either $730 or $764 decisively, with ADX staying below 20. Target: $720–$750. Invalidation: decisive break outside the $705–$770 range. (18% probability)
PRICE TARGETS
- Target Price: $718.00 (85-day horizon, about -2.0% from $733.00, reflecting a measured-move drift toward VWAP with a partial rebound)
- Expected Range: $652.00 to $788.00 (width $136 ≈ 18.6% of current price, consistent with the 61–180 day guidance)
- Key Levels: Support at $707.99 (VWAP; immediate support at $730.15 SMA 200D), Resistance at $764.00 (EMA 50, with SMA 50D at $766.40)
OVERALL BIAS
OVERALL BIAS: BEARISH - Price broke below the lower Bollinger Band and the $745–$785 range on heavy volume. MACD is bearish and widening, CMF shows distribution at -0.201, and −DI dominates +DI. The 200-day averages are the last support, and a loss of them points toward VWAP near $708. The oversold RSI leaves room for a bounce, so conviction is moderate.
This is educational analysis and not financial advice.