SPY 4-day bearish forecast — Nov 6, 2026
- Bias: Bearish
- Timeframe: 4 days (made Nov 6, 2026, target date Nov 9, 2026)
- Price at analysis: $735.40
- Price target: $731.50
- Expected range: $718.50 – $742.00
- Result: Incorrect (+2.4%) — closed at $752.78 on Nov 9, 2026; quality score 28/100
Get a free AI analysis of SPY today
Analysis
TECHNICAL INDICATORS
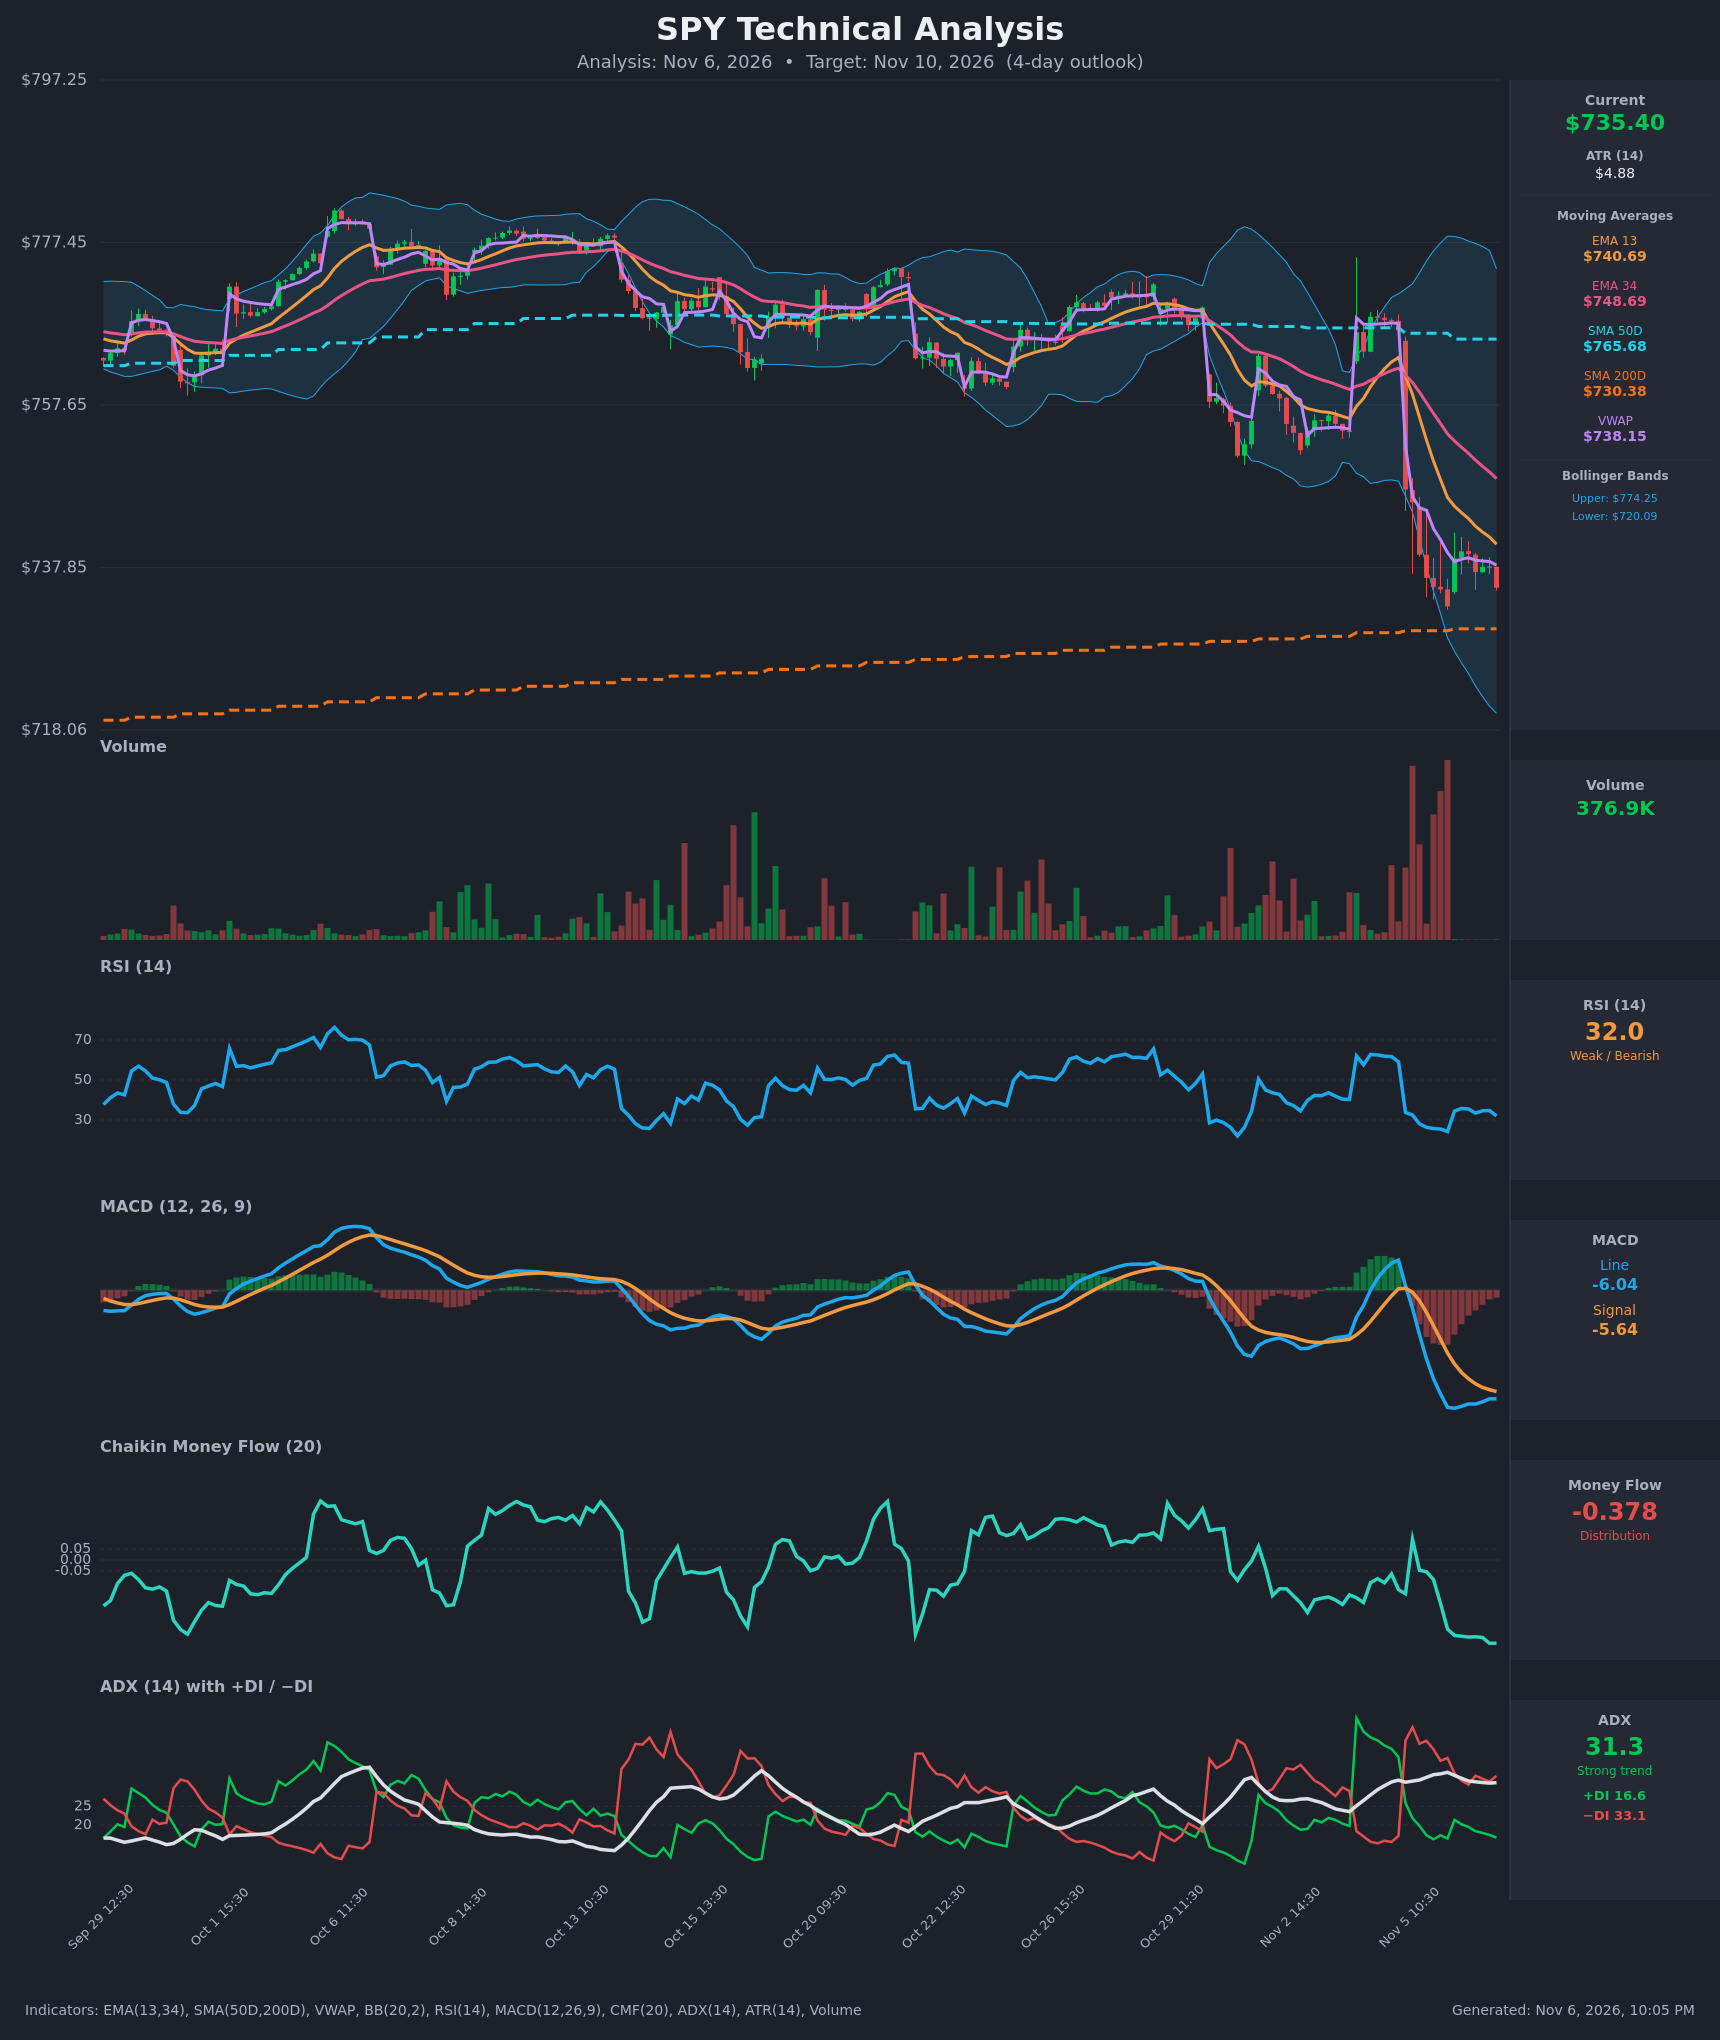
- RSI (14): 32.03, just above oversold (30). It bounced from 24 on Nov 5 to about 35, then rolled over again, so momentum is weak and not yet showing a bullish turn. [Bearish]
- 20 EMA: The chart's short EMA (EMA 13) is $740.69 and EMA 34 is $748.69. Price at $735.40 is below both, and both are sloping down, so they act as overhead resistance. EMA13 crossed below EMA34 on Nov 5. [Bearish]
- MACD: Line -6.04 is below Signal -5.64, a bearish crossover that happened on Nov 5. The histogram is slightly negative at about -0.41 and has been shrinking, so downside momentum is flattening but there is no bullish cross. [Bearish]
- Bollinger Bands (20): Upper $774.25, lower $720.09, midline about $747. Price sits in the lower third, about $15 above the lower band, after a sharp break below the middle band. The bands are wide after the gap-down, which signals elevated volatility. [Bearish]
- CMF (20): -0.378, well below -0.05 and at a recent low. This is heavy, persistent distribution with no sign of accumulation. [Distribution]
- ADX (14): 31.3 with −DI 33.1 over +DI 16.6. Bears are firmly in control and the trend is strong. ADX is easing slightly from 34, which suggests the trend is maturing. [Strong Trend – Bearish]
- Volume: The latest bar is 376.9K, far below the huge volume spikes on the Nov 5 breakdown. Selling was heavy and decisive on the break, and the recent drift lower is on lighter volume, which hints at a possible pause. [Bearish with fading intensity]
DIVERGENCES & TRENDS
- There is no clear bullish RSI or MACD divergence. RSI's recent low (about 32) is higher than the Nov 5 low (24), but price is also near its prior low (about $733 vs $735), so this is only a mild hint of stabilization.
- The MACD line has flattened around -6 and the histogram is shrinking, which suggests the downward acceleration is fading.
- EMA13 (740.69) is below EMA34 (748.69), and both are below SMA50D (765.68). Price is still above SMA200D ($730.38) by only about $5, so that level is the last long-term support.
- Price is below VWAP ($738.15), which shows intraday selling pressure.
- The −DI/+DI gap is wide, and CMF is deeply negative. Both confirm the downtrend.
CHART PATTERNS
- The chart does not show a clean reversal or continuation pattern. The Nov 5 gap-down followed by a lower-high consolidation (about $737–$740 on Nov 6) resembles a Bearish Flag/Pennant in the continuation family. Its measured target would be a further drop of roughly the pole's length, but price is already near SMA200D and the lower band, which should slow the move.
- Price is also coiling just above SMA200D at about $730. A Bullish Falling Wedge is not confirmed. A break below $730 would invalidate any base-building idea.
- Prior range highs near $775 are far overhead and irrelevant over 4 days.
POTENTIAL SCENARIOS
- Scenario 1: Bearish Flag Breakdown Toward SMA200D — The tight consolidation under EMA13 and VWAP resolves lower as distribution continues. Trigger: hourly close below $734 and then below $732. Target: $728–$730 (SMA200D), with an extension toward $722 (lower Bollinger Band). Invalidation: close above $741 (EMA13). (50% probability)
- Scenario 2: Neutral Consolidation Above SMA200D — Price holds above the 200-day, oscillating between $731 and $741 as selling exhausts. Trigger: SMA200D holds on tests. Target: $733–$739. Invalidation: close below $730 or above $742. (22% probability)
- Scenario 3: Bullish Oversold Bounce — Oversold RSI and the SMA200D support spark a relief rally toward the falling EMAs. Trigger: reclaim of VWAP ($738) and EMA13 ($741). Target: $745–$749 (EMA34). Invalidation: failure at $741 and a close below $733. (28% probability)
PRICE TARGETS
For the 4-day horizon (about 2–4% range width guidance scaled up slightly for a 4-day window, ~3–5%):
- Target Price: $731.50
- Expected Range: $718.50 to $742.00 (width $23.50 ≈ 3.2% of current price; adequate for a 4-day window with ATR of $4.88)
- Key Levels: Support at $730.38 (SMA200D), Resistance at $740.69 (EMA13)
OVERALL BIAS
OVERALL BIAS: BEARISH - Price is below all short-term moving averages and VWAP, with a bearish MACD cross, −DI dominating (33.1 vs 16.6), and CMF at -0.378. The most likely outcome is a drift toward the SMA200D near $730, although oversold RSI and that support limit the downside.
This is educational analysis and not financial advice.