SOXL 4-day bearish forecast — Nov 7, 2026
- Bias: Bearish
- Timeframe: 4 days (made Nov 7, 2026, target date Nov 10, 2026)
- Price at analysis: $45.94
- Price target: $44.60
- Expected range: $43.80 – $47.60
- Result: Incorrect (+22.0%) — closed at $56.06 on Nov 10, 2026; quality score 0/100
Get a free AI analysis of SOXL today
Analysis
TECHNICAL INDICATORS
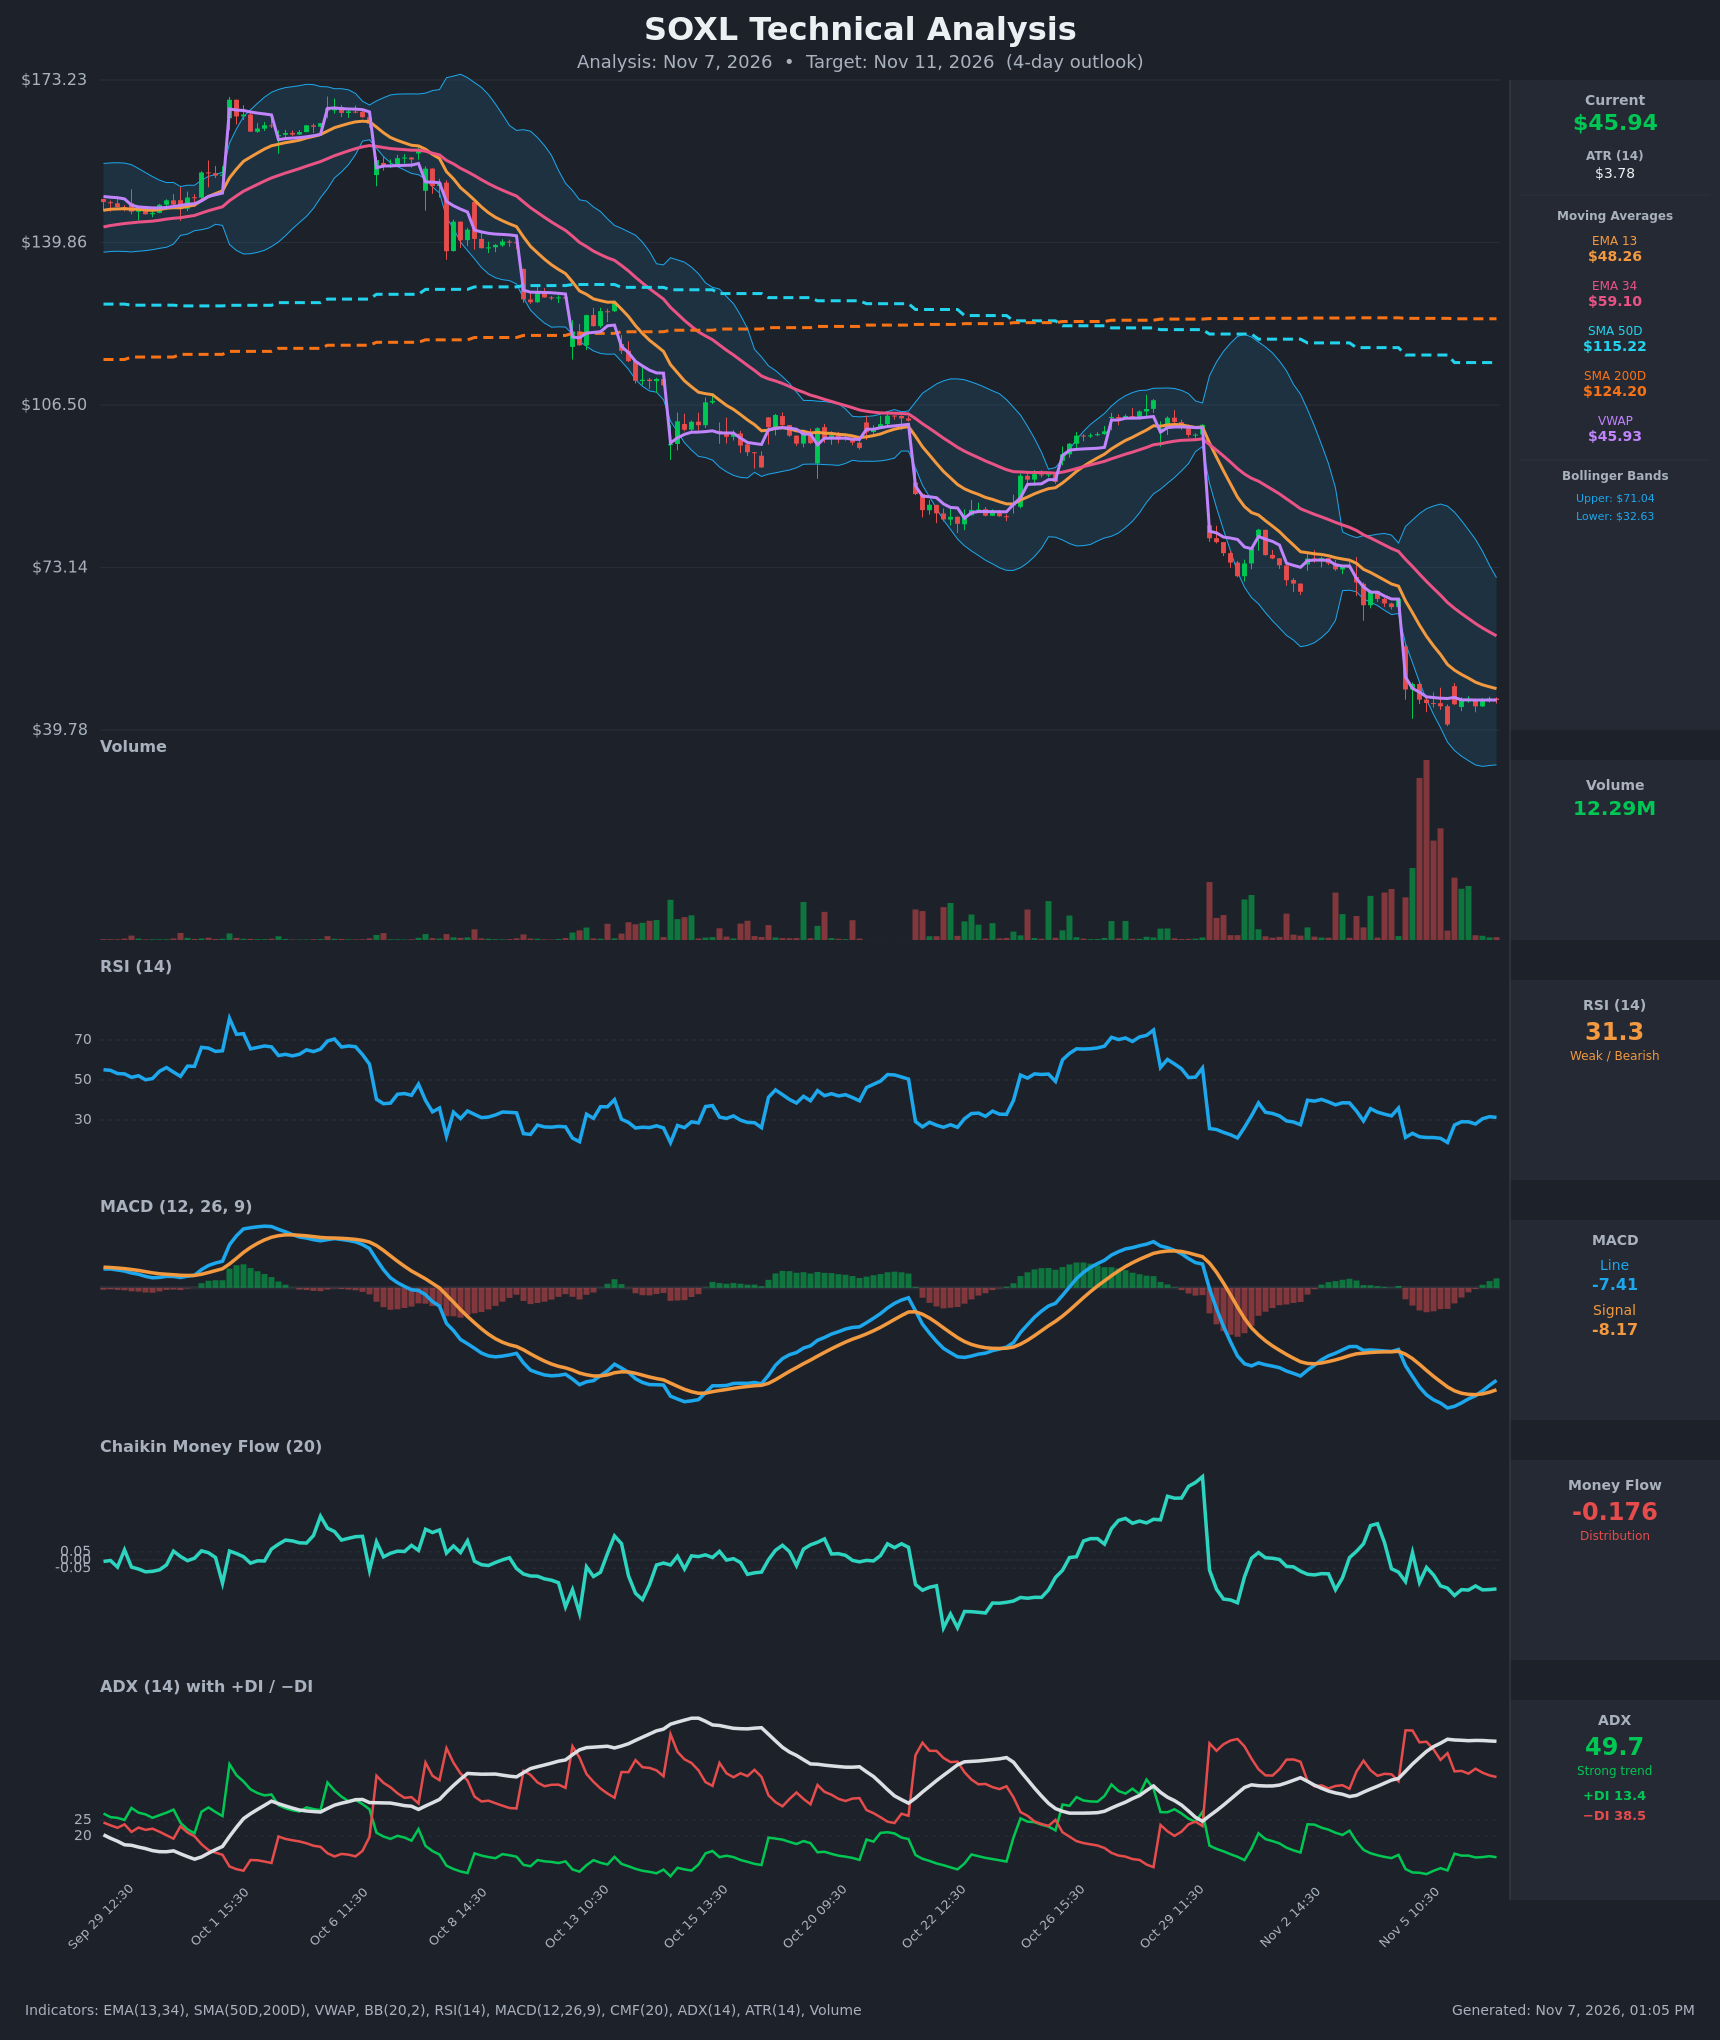
- RSI (14): 31.31, just above oversold. It bottomed at 18.8 on Nov 5 and has bounced to the high 20s and low 30s, but it is still below 40 and has made no move toward 50. [Bearish]
- 20 EMA: The supplied EMAs are 13 and 34. EMA13 is $48.26 and EMA34 is $59.10. Price at $45.94 is below both, and both are sloping down. EMA13 is the first overhead resistance, and the 13/34 bearish stack is intact. [Bearish]
- MACD: Line -7.41 is above signal -8.17, so there was a bullish crossover around Nov 6 13:30. The histogram is slightly positive and rising. However, both lines are deeply negative, so this is a relief bounce, not a trend reversal. [Neutral]
- Bollinger Bands (20): Upper $71.04, lower $32.63. The bands are extremely wide after the Nov 5 gap-down. Price is in the lower half, well under the midline (about $52), and not touching the lower band. That leaves room for more downside, and the bands are not signaling a reversal. [Bearish]
- CMF (20): -0.176, well below -0.05. It has been negative for most of the last two weeks and shows persistent distribution with no sign of accumulation. [Distribution]
- ADX (14): 49.7 with −DI 38.5 well above +DI 13.4. This is a very strong downtrend, though ADX has plateaued at about 50 (49.7 vs 50.3 peak), which can signal trend exhaustion or consolidation. Bears are firmly in control. [Strong Trend – Bearish]
- Volume: 12.29M, far below the capitulation volume spike at the Nov 5 gap-down. Volume is fading during the sideways consolidation, so the bounce lacks buying conviction. Price is pinned at VWAP ($45.93). [Neutral-to-Bearish]
DIVERGENCES & TRENDS
- There is a mild bullish divergence in momentum. RSI made its low at 18.8 and the MACD histogram turned up, but price has only moved sideways at about $45. It has not made a higher low in a way that confirms a reversal.
- The MACD bullish crossover is the only notable bullish signal. The history on the chart shows prior MACD crossovers in this downtrend failing at lower highs.
- Price is far below SMA50D ($115.22) and SMA200D ($124.20). The death cross is long established, and both averages are still declining.
- EMA13 is sloping down toward price (gap about $2.3), so a bounce would likely meet resistance at $48.26.
- Over the last 10 bars, price is stalling in a tight $44.64–$46.24 range on VWAP, after a steep drop from $66.67.
CHART PATTERNS
- The best fit is a Bearish Flag/Pennant (continuation). A sharp impulse down from $66 to $41 was followed by a tight, low-volume sideways consolidation at $44.6–$46.3.
- A breakdown below about $44.60 targets a retest of the Nov 5 low at $40.90. The measured move, equal to the flagpole, would extend toward the lower Bollinger band at about $32.6, though that is beyond a 4-day horizon.
- The alternative is a short-term base or double bottom near $41 and $44.6, which would need a close above EMA13 ($48.26) to confirm. There is no confirmation yet.
POTENTIAL SCENARIOS
- Scenario 1: Bearish Flag Breakdown — Price fails to reclaim EMA13 and loses the $44.60 consolidation floor. −DI stays dominant and CMF stays negative, so sellers push toward the prior low. Trigger: hourly close below $44.60. Target: $41.00–$43.00. Invalidation: hourly close above $48.30. (50% probability)
- Scenario 2: Bullish Oversold Relief Bounce — The MACD crossover and the oversold RSI base attract short covering, and price rallies into EMA13 resistance. Trigger: close above $47.00 with rising volume. Target: $48.30–$50.00. Invalidation: drop back below $44.60. (33% probability)
- Scenario 3: Neutral Continued Consolidation — Price chops around VWAP in the $44.5–$47 range as ADX cools. Trigger: no break of either side. Target: $45–$46.50. Invalidation: close outside $44.50–$47.50. (17% probability)
PRICE TARGETS
- Target Price: $44.60 (4-day, Nov 11, 2026)
- Expected Range: $43.80 to $47.60 (width $3.80, about 8.3% of the current price, appropriate for a 4-day horizon)
- Key Levels: Support at $40.90 (Nov 5 low; nearer minor support at $44.60), Resistance at $48.26 (EMA13)
OVERALL BIAS
OVERALL BIAS: BEARISH - The downtrend is very strong (ADX 49.7, −DI 38.5 vs +DI 13.4). Price is below all key moving averages, CMF shows persistent distribution, and the tight low-volume consolidation looks like a bearish flag. The MACD crossover and the oversold bounce raise the risk of a relief rally toward EMA13 at $48.26, but they are not enough to override the trend.
This is educational analysis and not financial advice.