SOXL 7-day bearish forecast — Nov 7, 2026
- Bias: Bearish
- Timeframe: 7 days (made Nov 7, 2026, target date Nov 13, 2026)
- Price at analysis: $45.94
- Price target: $43.80
- Expected range: $42.30 – $46.00
- Result: Incorrect (+26.9%) — closed at $58.32 on Nov 13, 2026; quality score 0/100
Get a free AI analysis of SOXL today
Analysis
TECHNICAL INDICATORS
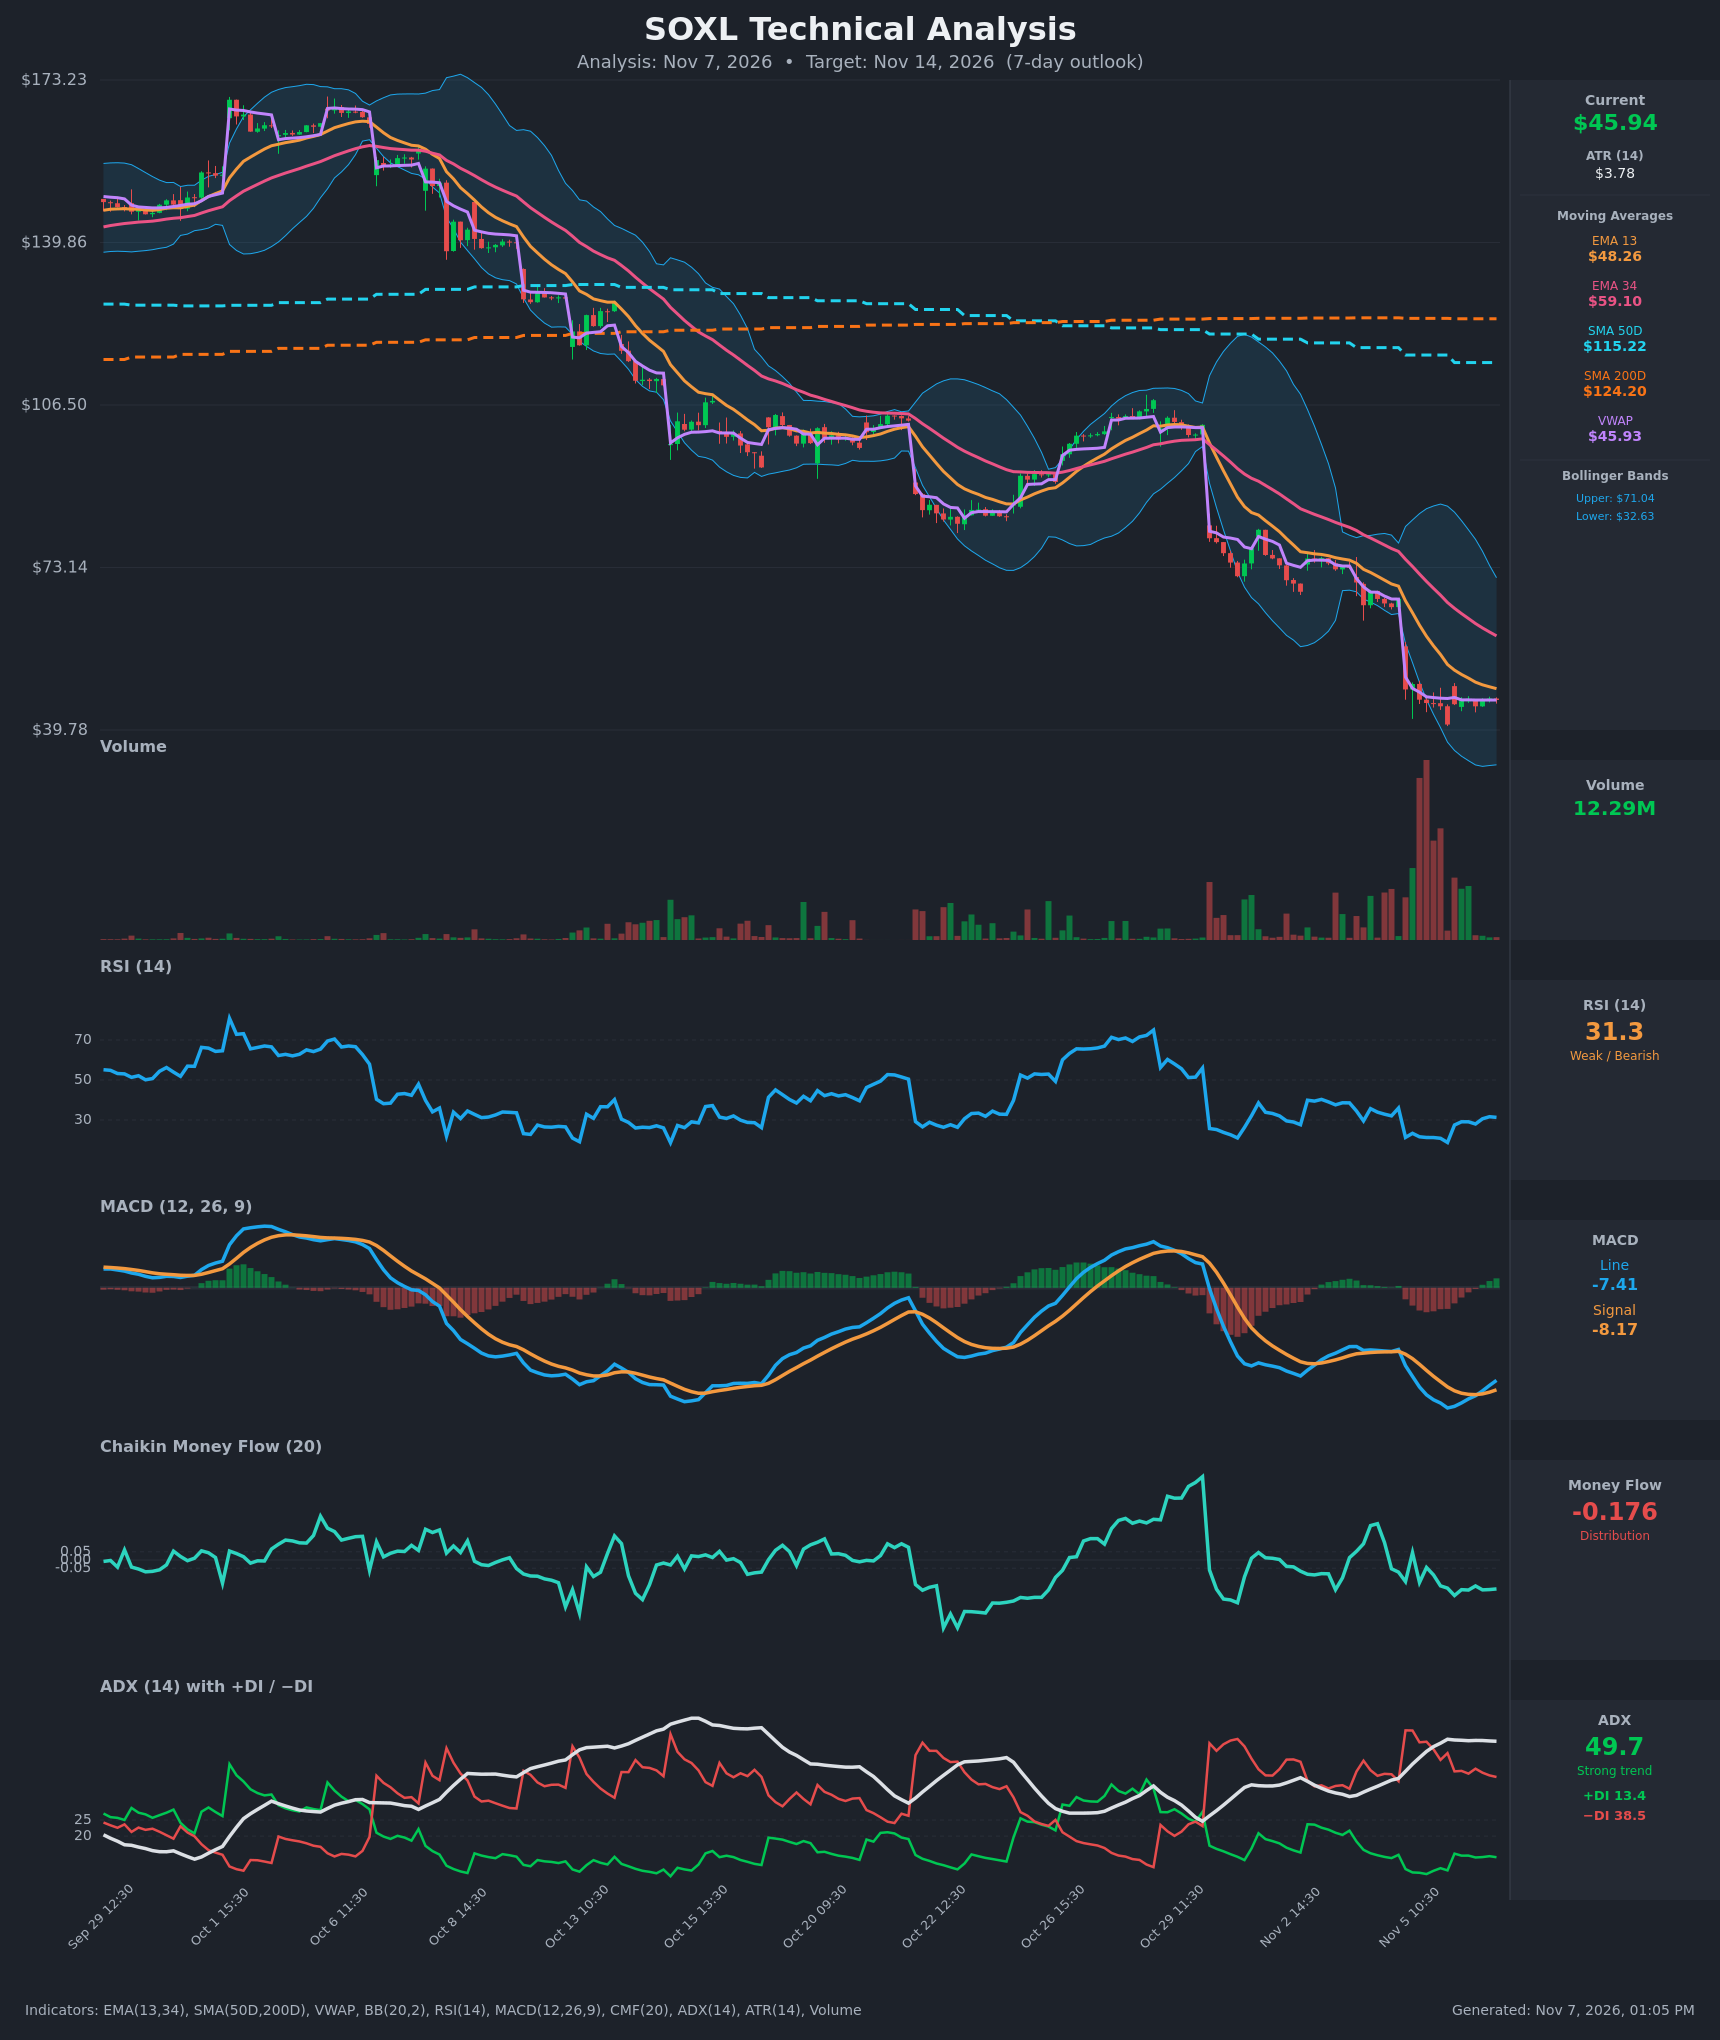
- RSI (14): 31.31, up from a 18.8 low on Nov 5 15:30 and sitting just above the oversold line at 30. The bounce is shallow and RSI has not yet reclaimed 40, so momentum is still weak. Oversold conditions do not guarantee a reversal in a strong downtrend. [Bearish]
- 20 EMA: The data gives EMA 13 at $48.26 and EMA 34 at $59.10. Price at $45.94 is below both, and both are still falling, so they act as overhead resistance. EMA 13 is below EMA 34, a bearish alignment, and the gap is only narrowing slowly. [Bearish]
- MACD: Line -7.41 is above Signal -8.17, which is a fresh bullish crossover on Nov 6 14:30–15:30. Both lines are deeply negative, and the histogram has only just turned slightly positive. This is a relief signal inside a larger downtrend, not a trend reversal. [Neutral]
- Bollinger Bands (20): Upper $71.04, lower $32.63, midline about $51.84. Price is below the midline and in the lower half of the bands, but well above the lower band, so it is not at a statistical extreme. The bands are very wide after the Nov 5 gap, which means high volatility. [Bearish]
- CMF (20): -0.176, well below -0.05 and persistently negative since the Nov 5 breakdown. Selling pressure is dominant and no accumulation is visible yet. [Distribution]
- ADX (14): 49.7, a very strong and mature trend, flat to slightly lower over the last several bars. −DI at 38.5 is far above +DI at 13.4, so bears are in full control. An ADX near 50 can precede pauses or relief bounces, but the direction is still down. [Strong Trend – Bearish]
- Volume: 12.29M on the latest bar, far below the capitulation spike around the Nov 5 gap. Volume has faded during the sideways drift at $44–46. This is consistent with a pause or bear flag, not a volume-confirmed bottom. [Neutral to Bearish – selling climax passed, no accumulation]
DIVERGENCES & TRENDS
- Early bullish divergence: Price made lower lows on Nov 5 15:30 ($40.90) and then held roughly $44.6–46.2. RSI has recovered from 18.8 to 31.3 and MACD has crossed up. This is a mild relief signal, but price has not made a clear higher low.
- Trend structure: Price is far below SMA50D ($115.22) and SMA200D ($124.20), and has been below both for the entire visible period. The death cross is already in place. EMA 13 and EMA 34 are both falling.
- VWAP: Price ($45.94) is pinned to VWAP ($45.93), so there is no edge from this indicator right now. A move below VWAP would favor sellers.
- DI lines: −DI has been above +DI throughout. +DI ticked up from 8 to about 13–14 but remains far below −DI.
- CMF: It briefly touched positive (+0.045) on Nov 5 10:30 and rolled back over to -0.176. That is a failed bounce.
CHART PATTERNS
- Bearish Flag / Pennant (continuation): After the near-vertical gap-down from $66.67 to $48.10, price has consolidated in a tight $44.6–46.2 band. This resembles the Bearish Flag/Pennant in the reference diagram. A breakdown below about $44.6 targets a measured-move extension, with the first target near the Nov 5 low at $40.90 and then the lower Bollinger Band near $32.6.
- Alternative reading: The Bullish Falling Wedge or a double-bottom attempt near $40.90–44.6 would only be confirmed by a close above EMA 13 (about $48.26) and the $49.22 high of the post-gap range. This is the lower-probability read.
- Larger structure: The long series of lower highs and lower lows since the $173 peak forms a persistent downtrend channel, not a reversal base.
POTENTIAL SCENARIOS
- Scenario 1: Bearish Flag Breakdown — The tight consolidation resolves lower as sellers resume control. ADX near 50, −DI dominance and negative CMF favor continuation. Trigger: hourly close below $44.60, then below the $40.90 low. Target: $42.00–43.80 within 7 days, with extension toward $40.90. Invalidation: close above $48.26 (EMA 13). (50% probability)
- Scenario 2: Bullish Relief Bounce — The oversold RSI and fresh MACD crossover fuel a mean-reversion bounce toward the declining EMA 13 and the middle of the range. Trigger: break above $46.25–46.50 on rising volume. Target: $48.26 (EMA 13), then $49.22. Invalidation: close back below $44.60. (35% probability)
- Scenario 3: Neutral Sideways Base — Price keeps chopping around VWAP in the $44–47 band as the selling climax digests. Trigger: continued low-volume drift with no break either way. Target: $44.50–46.50. Invalidation: decisive close outside $44.00–47.50. (15% probability)
PRICE TARGETS
Self-check: range width = $46.00 − $42.30 = $3.70, which is 8.05% of $45.94. That fits the 7–10 day guideline of roughly 4–8%.
- Target Price: $43.80 (7 days)
- Expected Range: $42.30 to $46.00
- Key Levels: Support at $40.90, Resistance at $48.26
OVERALL BIAS
OVERALL BIAS: BEARISH - The trend is overwhelmingly down: ADX is near 50 with −DI far above +DI, CMF is deeply negative, and price is below all moving averages, including a death-cross SMA50D/SMA200D. The tight, low-volume consolidation after the gap-down looks like a bearish flag. The MACD crossover and near-oversold RSI argue for a relief bounce, but they have not yet changed the structure.
This is educational analysis and not financial advice.