NVDA 4-day bearish forecast — Nov 7, 2026
- Bias: Bearish
- Timeframe: 4 days (made Nov 7, 2026, target date Nov 10, 2026)
- Price at analysis: $186.68
- Price target: $184.50
- Expected range: $181.50 – $190.50
- Result: Correct (-9.5%) — closed at $168.89 on Nov 10, 2026; quality score 50/100
Get a free AI analysis of NVDA today
Analysis
TECHNICAL INDICATORS
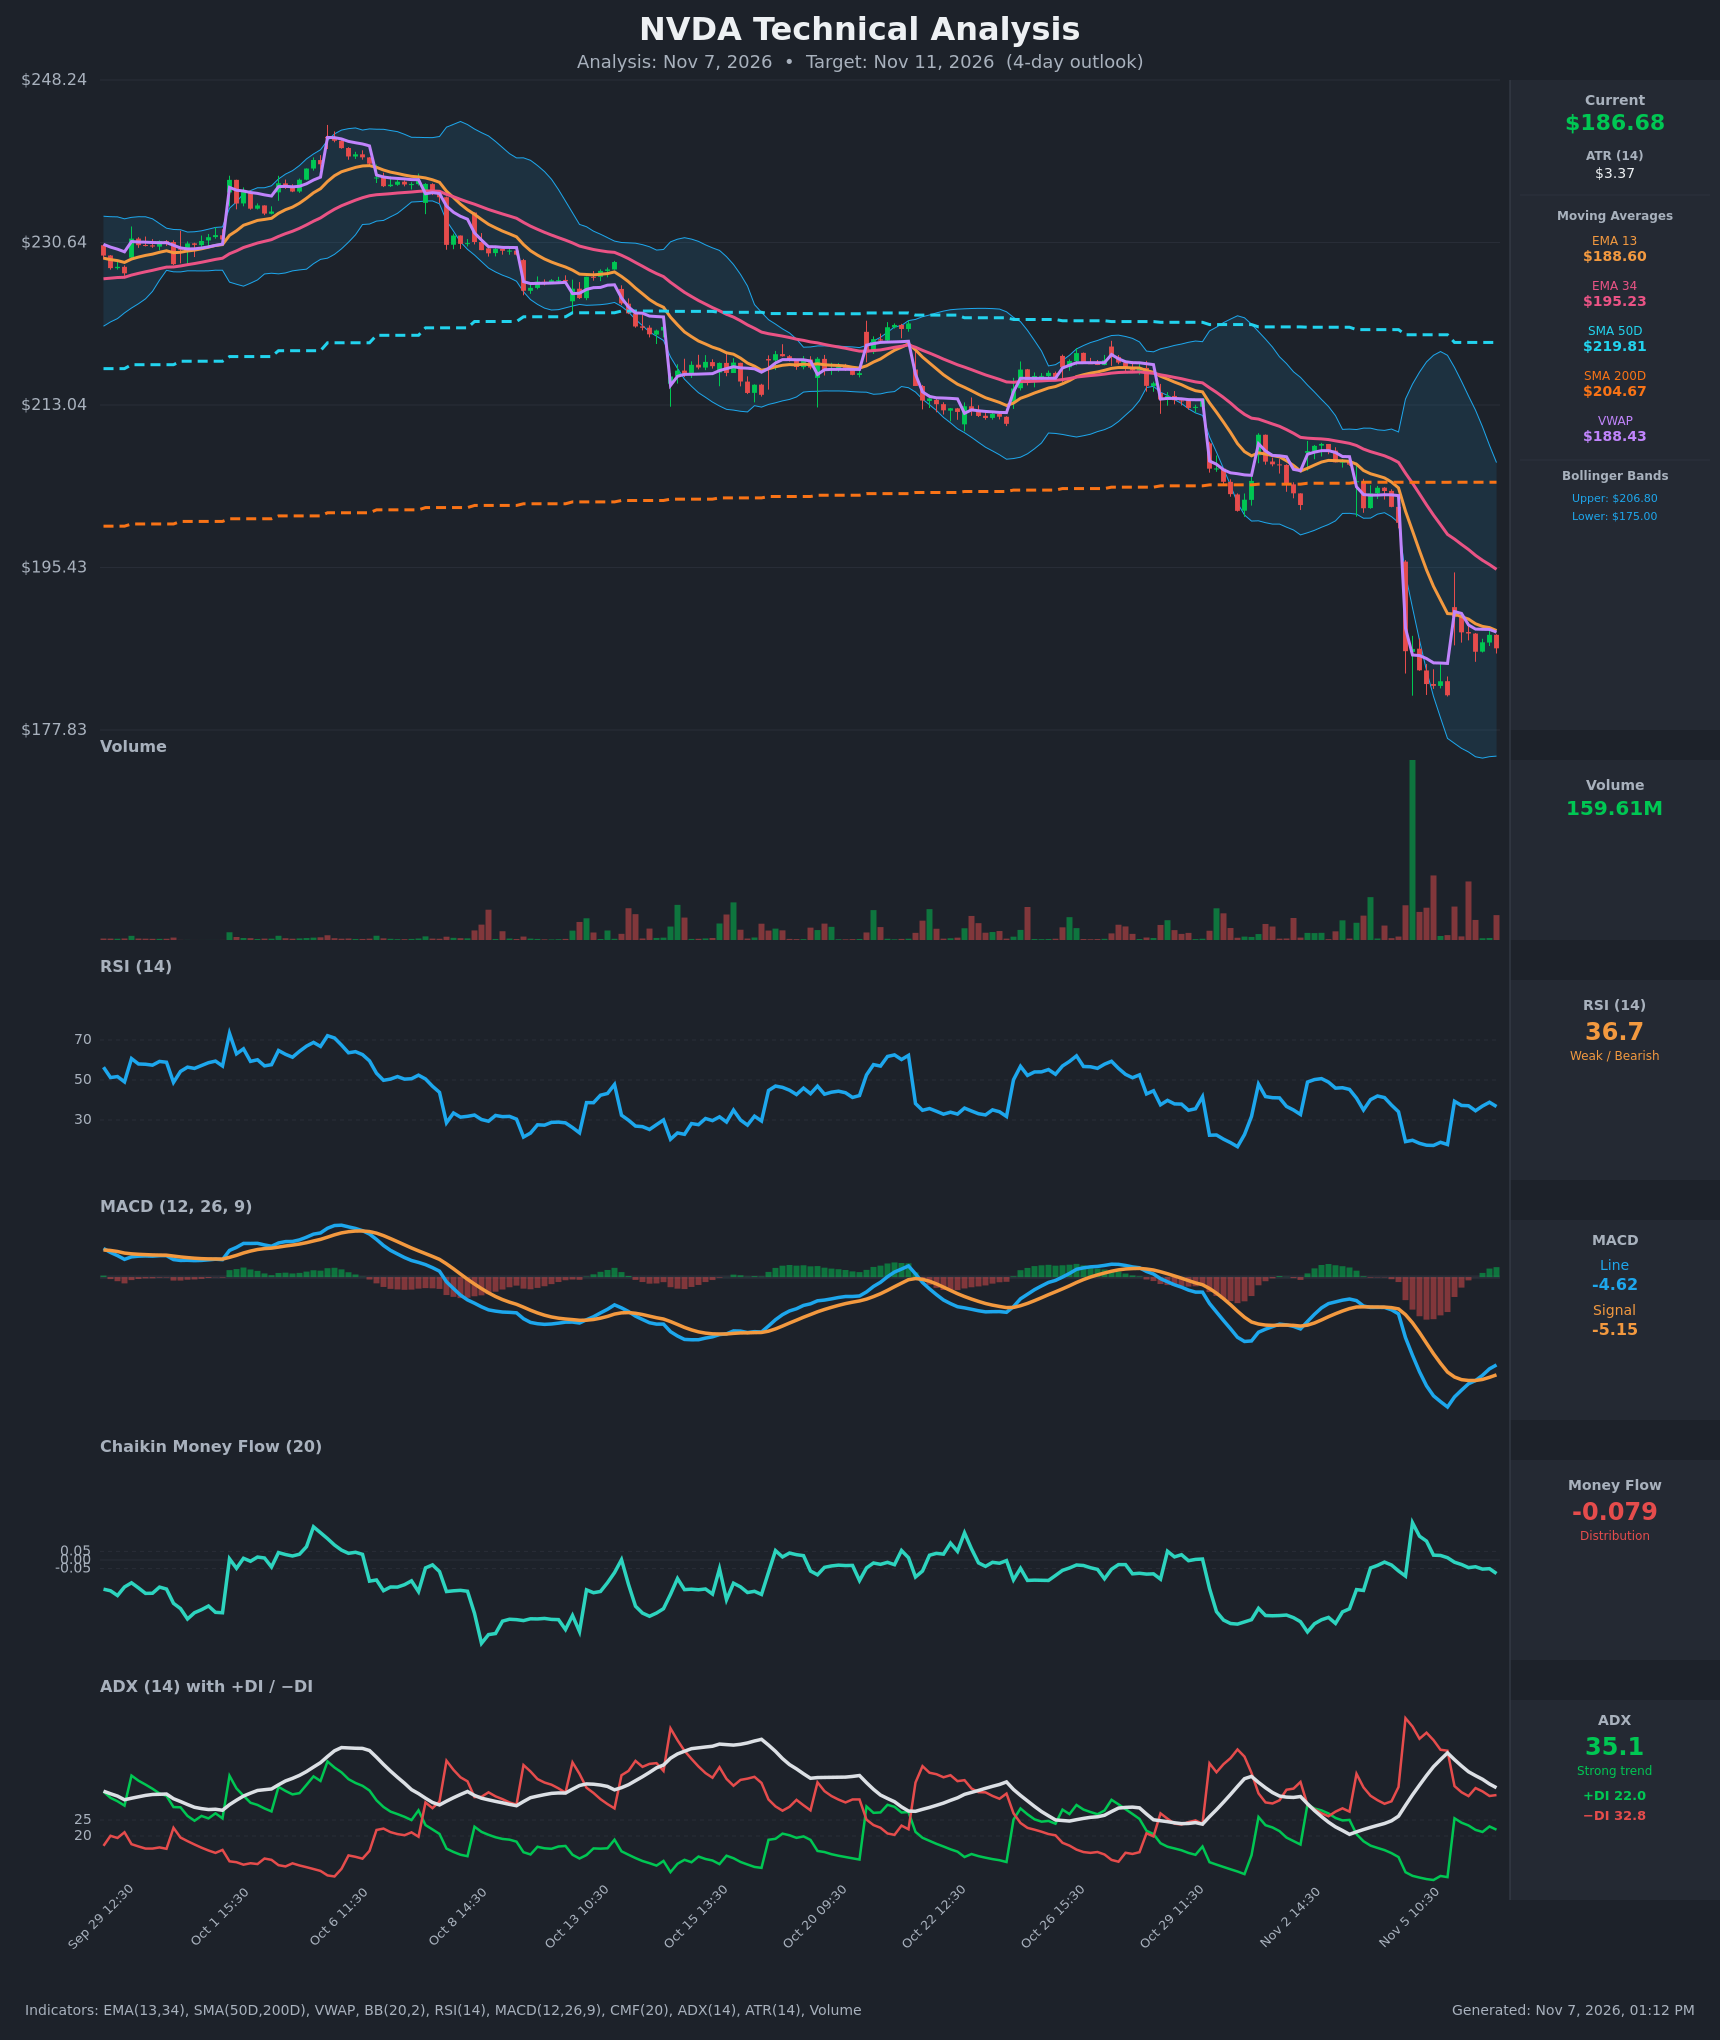
- RSI (14): 36.73. It rebounded from a deeply oversold 17.3 on Nov 5 but has stalled in the high-30s and is now rolling over (38.9 → 36.7). It remains below 50 with no bullish divergence. [Bearish]
- 20 EMA: The chart shows EMA 13 ($188.60) and EMA 34 ($195.23). Price at $186.68 is below both, and EMA13 is below EMA34 and falling, so both act as overhead resistance. VWAP at $188.43 sits just above price and is also resistance. [Bearish]
- MACD: Line -4.62 is above Signal -5.15, so a bullish crossover happened around Nov 6 13:30. The histogram is slightly positive (+0.52) but both lines are deeply negative, far below zero. This looks like a relief bounce within a downtrend, not a trend reversal. [Neutral]
- Bollinger Bands (20): Upper $206.80, lower $175.00, midline about $190.90. Price is in the lower half of the bands, about 37% of the way up from the lower band. The bands are wide after the Nov 5 gap-down, which means elevated volatility. Price is no longer pressing the lower band, so the bounce has already partly played out. [Neutral]
- CMF (20): -0.079, below the -0.05 threshold. It has drifted down from a spike on Nov 5, which means selling pressure is returning on the bounce. [Distribution]
- ADX (14): 35.1, a strong trend, though ADX has been falling from 46 as the selloff pauses. −DI (32.8) is above +DI (22.0), so bears remain in control. +DI has recovered from 7 but is not crossing above −DI. [Strong Trend – Bearish]
- Volume: 159.61M. There was a huge spike on the Nov 5 gap-down (capitulation-type volume), and volume has faded since while price consolidates. The bounce occurred on lighter volume, so buyers are not showing strong conviction. [Bearish/Neutral – weak bounce]
DIVERGENCES & TRENDS
- There is no clean bullish price/RSI divergence. RSI made a low at 17 and price made a low at $181.59, so both confirm the lows. RSI is now making lower highs (39.3 → 38.9) on a flat price.
- MACD crossed up from deep negative territory, a short-term momentum improvement. It remains far below zero, so this is a counter-trend signal.
- The EMA13 < EMA34 < SMA200D < SMA50D ordering is bearish. SMA50D ($219.81) is above SMA200D ($204.67), so a death cross has not occurred, but price is about 9% below SMA200D and 15% below SMA50D, which is a long-term breakdown.
- ADX is falling from its peak while −DI leads. This suggests the downtrend is pausing and consolidating, not reversing.
- CMF is trending back toward distribution after a brief positive spike.
CHART PATTERNS
- Bearish Flag / Pennant (continuation): After the sharp gap-down from about $200 to $182, price has formed a tight, slightly rising consolidation between about $181.6 and $190. This resembles the bearish flag/pennant in the reference. A breakdown below $181.6 targets the measured move (flagpole of about $18) toward the $165–170 area. That is a multi-week objective, and only part of it is relevant within 4 days.
- Gap-down overhead supply: The Nov 5 gap leaves unfilled supply between $190 and $200, and price has failed to reclaim EMA13/VWAP.
- No completed bullish reversal pattern, such as a double bottom, is confirmed yet. A reclaim of the $190–191 area would be the first sign of a Bullish Falling Wedge or double-bottom attempt.
POTENTIAL SCENARIOS
- Scenario 1: Bearish Flag Breakdown — Price fails at EMA13/VWAP (~$188.5), rolls over with −DI dominant and CMF in distribution, and retests the Nov 5 low zone. Trigger: rejection at $188.5–190 or a break below $184. Target: $182–$181.60, with an extension to about $178. Invalidation: a daily close above $191. (50% probability)
- Scenario 2: Bullish Relief Rally — The bullish MACD cross and oversold RSI extend the bounce toward the Bollinger midline and the top of the gap. Trigger: a reclaim of $188.60 EMA13/VWAP on rising volume. Target: $190.90–$195 (EMA34). Invalidation: a break below $181.60. (33% probability)
- Scenario 3: Neutral Consolidation — Price chops between $183 and $189 as volatility compresses after the gap. Trigger: low-volume, inside-range trade. Target: $185–$188. Invalidation: a close outside $181.60–$191. (17% probability)
PRICE TARGETS
- Target Price: $184.50 (4-day horizon, Nov 11)
- Expected Range: $181.50 to $190.50 (width $9.00, about 4.8% of the current price, consistent with a ~4-day window and about 2.7x the ATR of $3.37)
- Key Levels: Support at $181.59, Resistance at $188.60
OVERALL BIAS
OVERALL BIAS: BEARISH - Price remains below all key moving averages and VWAP, with −DI above +DI at ADX 35, CMF in distribution, and a bounce on fading volume that looks like a bear flag. The MACD cross and oversold relief offer some upside risk, but they are counter-trend while price is capped under $188.60.
This is educational analysis and not financial advice.