SPY 4-day bearish forecast — Nov 7, 2026
- Bias: Bearish
- Timeframe: 4 days (made Nov 7, 2026, target date Nov 10, 2026)
- Price at analysis: $735.34
- Price target: $731.00
- Expected range: $719.00 – $746.00
- Result: Incorrect (+2.0%) — closed at $749.92 on Nov 10, 2026; quality score 41/100
Get a free AI analysis of SPY today
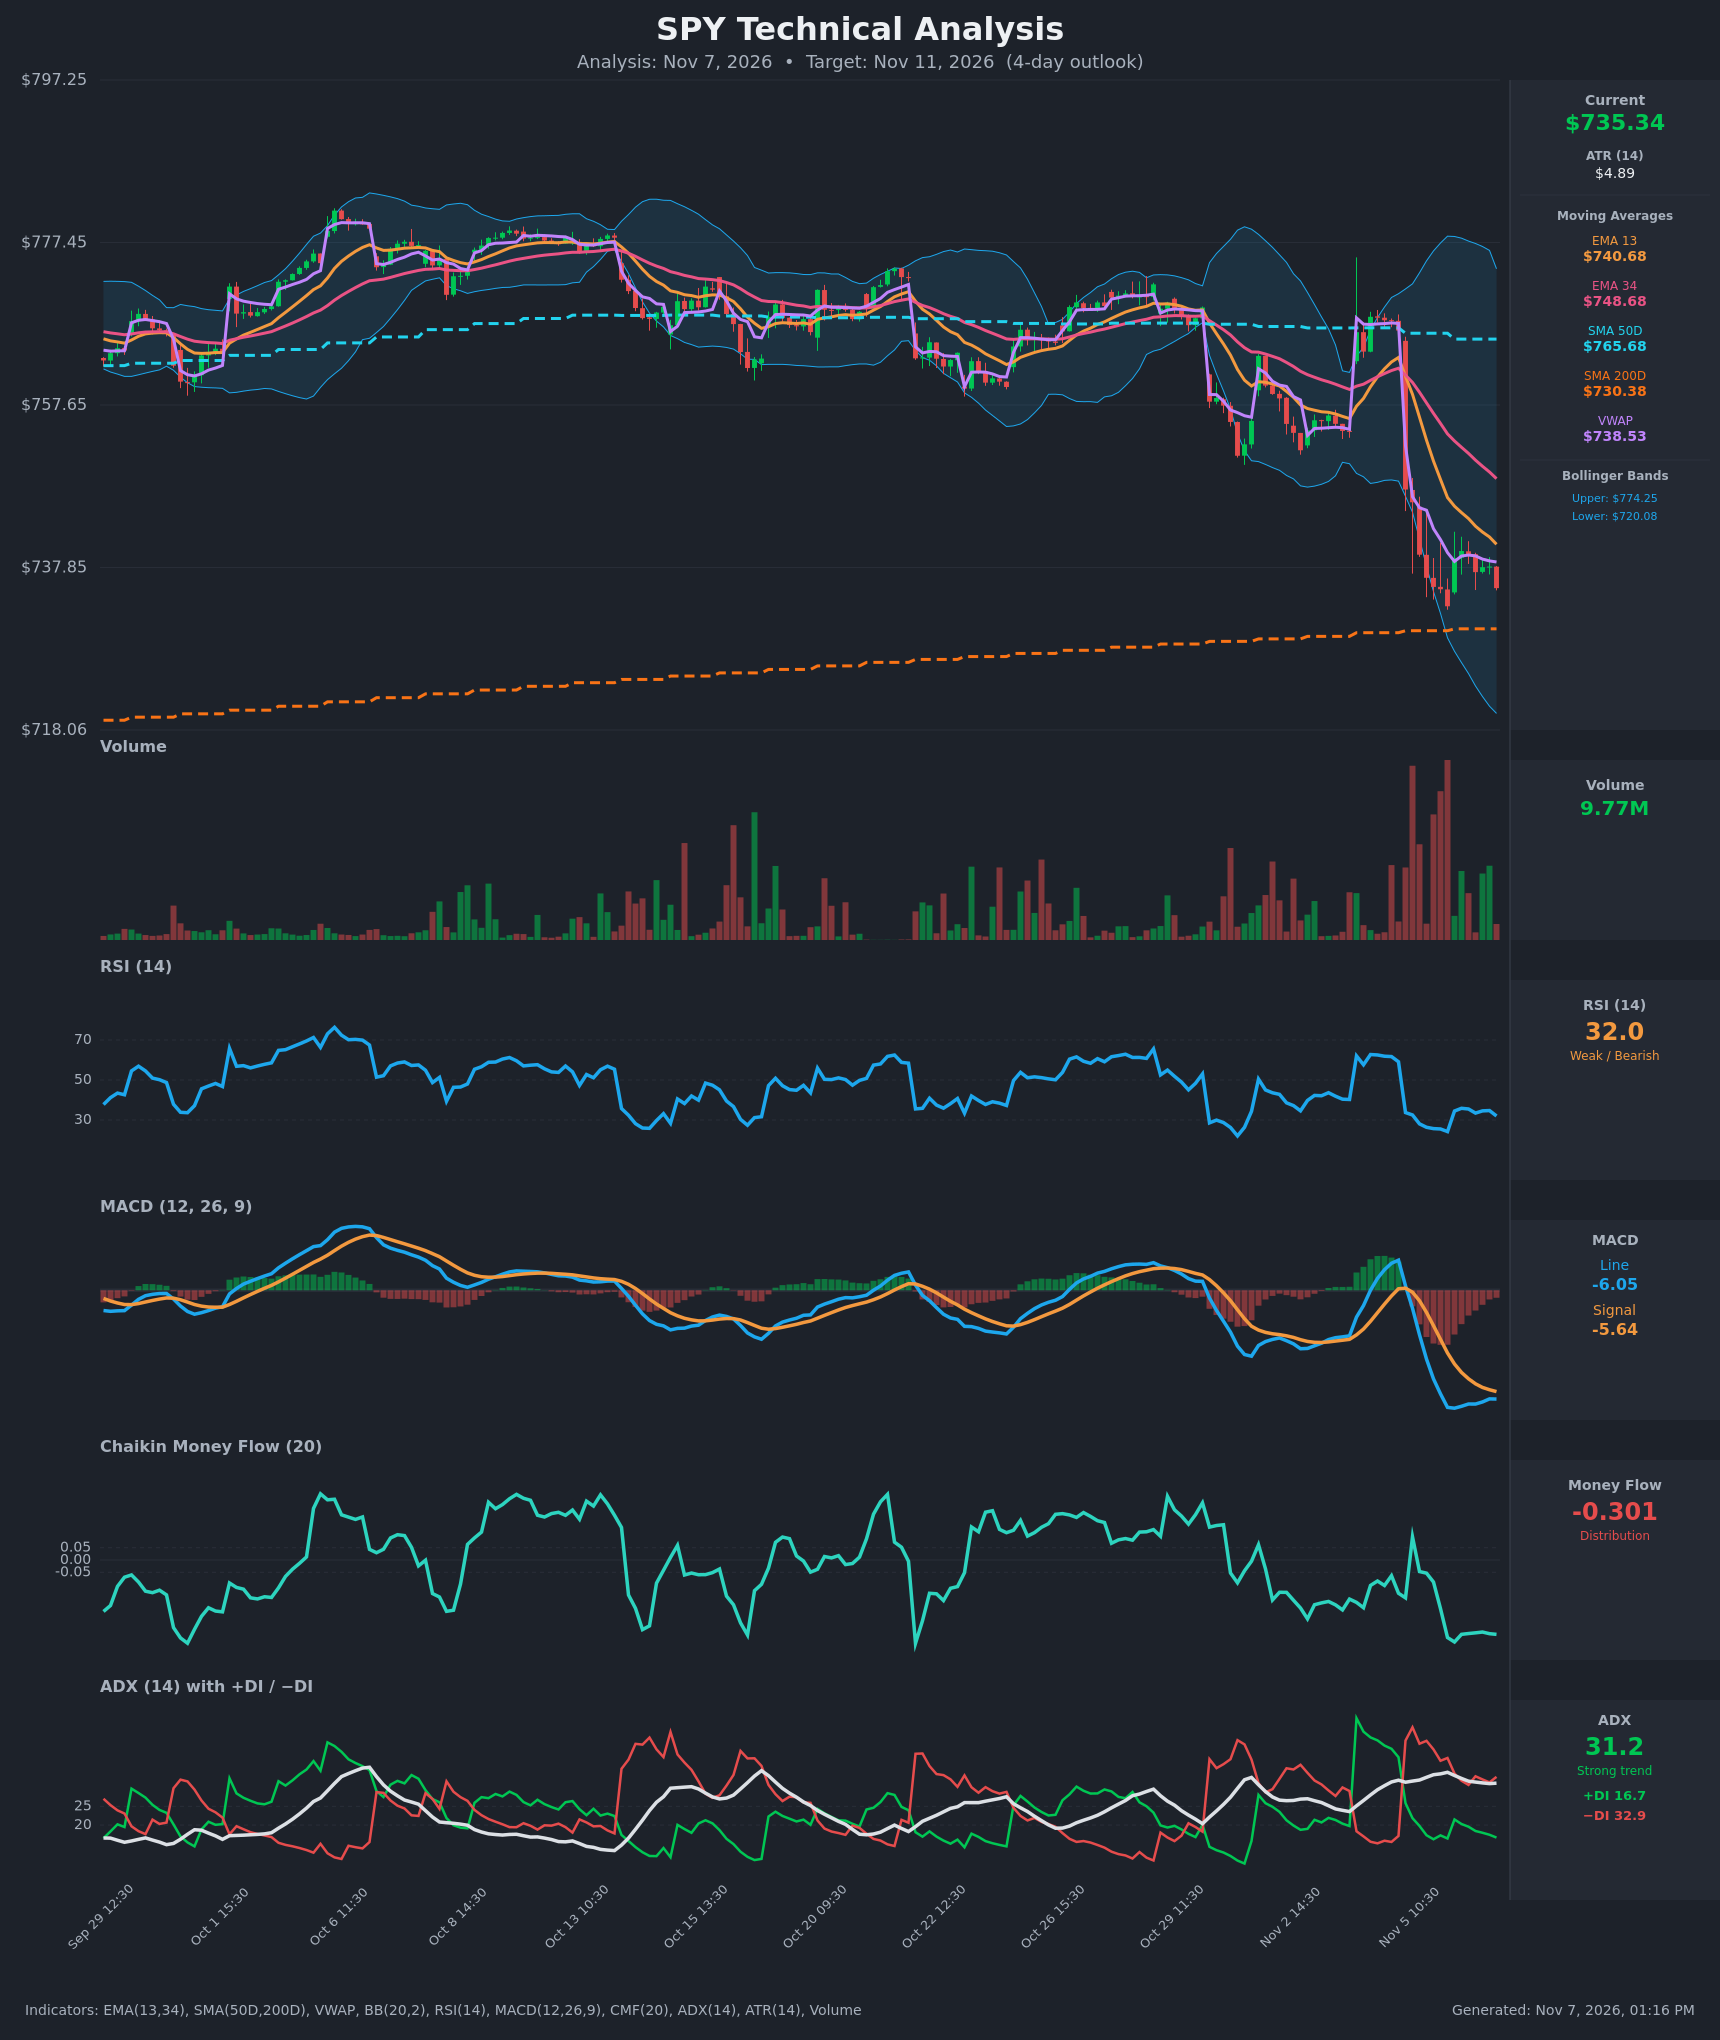
Analysis
TECHNICAL INDICATORS
- RSI (14): 32.00, just above the oversold line at 30. It hit about 24 on Nov 5, bounced to about 35, and has rolled over again. Momentum is weak with no bullish reversal yet. [Bearish]
- 20 EMA: The data gives EMA 13 at $740.68 and EMA 34 at $748.68. Price at $735.34 is below both, and both are sloping down. EMA13 is below EMA34, a bearish alignment, and EMA13 acts as near-term resistance. [Bearish]
- MACD: Line -6.05 is below Signal -5.64, a histogram of about -0.41. The bearish crossover happened on Nov 5 around 10:30. The histogram has shrunk from about -2.5 at the trough, so downside momentum is fading, but there is no bullish cross. [Bearish]
- Bollinger Bands (20): Upper $774.25, lower $720.08, midline near $747. Price sits in the lower third of the bands, about $15 above the lower band. The bands are wide after the volatility expansion and price has been walking the lower half. [Bearish]
- CMF (20): -0.301, well below -0.05 and near the lowest reading on the chart. That is heavy, persistent distribution with no sign of accumulation. [Distribution]
- ADX (14): 31.2 with −DI 32.9 over +DI 16.7. This is a strong trend with bears firmly in control. ADX has eased slightly from 34 but stays above 25. [Strong Trend – Bearish]
- Volume: The latest bar is 9.77M. Volume spiked heavily on the Nov 5 breakdown (mostly red bars) and has faded during the tight consolidation since. A few green bars appear on bounces, but there is no convincing capitulation reversal volume. [Neutral-to-Bearish: selling climax followed by a low-volume pause]
DIVERGENCES & TRENDS
- No bullish RSI divergence yet. RSI is at 32 versus a prior low of about 24 while price is only marginally above its low, so there is no higher-low confirmation in RSI.
- MACD histogram is contracting toward zero, an early sign of selling exhaustion. It needs a cross above the signal line to matter.
- A death cross is not in play: SMA50D ($765.68) is far above SMA200D ($730.38). SMA50D is flattening and price is well below it, which is trend damage.
- Price is $4.96 (about 0.7%) above SMA200D, the key long-term support. A close below it would be significant.
- Price is below VWAP ($738.53), which is resistance. EMA13 and EMA34 are falling and widening away from price.
- The −DI/+DI gap (about 16 points) and the Nov 5 DI crossover confirm a bearish trend regime.
CHART PATTERNS
- Bearish Pennant/Flag (continuation): After the sharp gap-down from about $766 to $735 on Nov 5, price has consolidated in a tight $733–$740 range with lower highs. This resembles a bearish pennant/flag. A break below about $733 projects further downside, and the measured move is large, but SMA200D at $730.38 should slow the first leg.
- Reversal caution: Price is near SMA200D and approaching the lower Bollinger Band. A Bullish Double Bottom could form if $733 holds on a retest, but it is not confirmed.
- The gap-down and failure to reclaim EMA13 are consistent with a trend continuation rather than a V-bottom.
POTENTIAL SCENARIOS
- Scenario 1: Bearish Pennant Breakdown — The consolidation resolves lower, price loses $733 and tests SMA200D. With ADX above 30, −DI dominant and CMF at -0.30, sellers keep control. Trigger: hourly close below $733 and then below $730.38. Target: $728–$731, with an extension toward $720 (lower BB). Invalidation: hourly close above $741 (EMA13/VWAP). (50% probability)
- Scenario 2: Bullish Oversold Bounce off SMA200D — RSI near 30 and a shrinking MACD histogram spark a relief rally as buyers defend the long-term average. Trigger: hold above $730 and a push over VWAP at $738.53. Target: $741–$748 (EMA13, then EMA34). Invalidation: close below $730. (33% probability)
- Scenario 3: Neutral Range Chop — Price stays pinned between SMA200D support and EMA13/VWAP resistance while volatility compresses. Trigger: no close outside $730–$741. Target: $734–$738. Invalidation: a close outside the range. (17% probability)
PRICE TARGETS
For the 4-day horizon (through Nov 11):
- Target Price: $731.00
- Expected Range: $719.00 to $746.00 (width $27, about 3.7% of price, in line with a 4-day horizon)
- Key Levels: Support at $730.38 (SMA200D), Resistance at $740.68 (EMA13)
OVERALL BIAS
OVERALL BIAS: BEARISH - Strong bearish trend (ADX 31 with −DI far above +DI), price below all short-term averages and VWAP, a bearish MACD cross and heavy distribution (CMF -0.30). The tight consolidation after the gap-down looks like a bearish continuation pennant. Conviction is modest because price sits just above SMA200D with RSI near oversold, so a bounce is a real risk.
This is educational analysis and not financial advice.