QBTS 4-day bullish forecast — Nov 7, 2026
- Bias: Bullish
- Timeframe: 4 days (made Nov 7, 2026, target date Nov 10, 2026)
- Price at analysis: $10.66
- Price target: $10.95
- Expected range: $10.10 – $11.55
- Result: Incorrect (-1.7%) — closed at $10.48 on Nov 10, 2026; quality score 33/100
Get a free AI analysis of QBTS today
Analysis
TECHNICAL INDICATORS
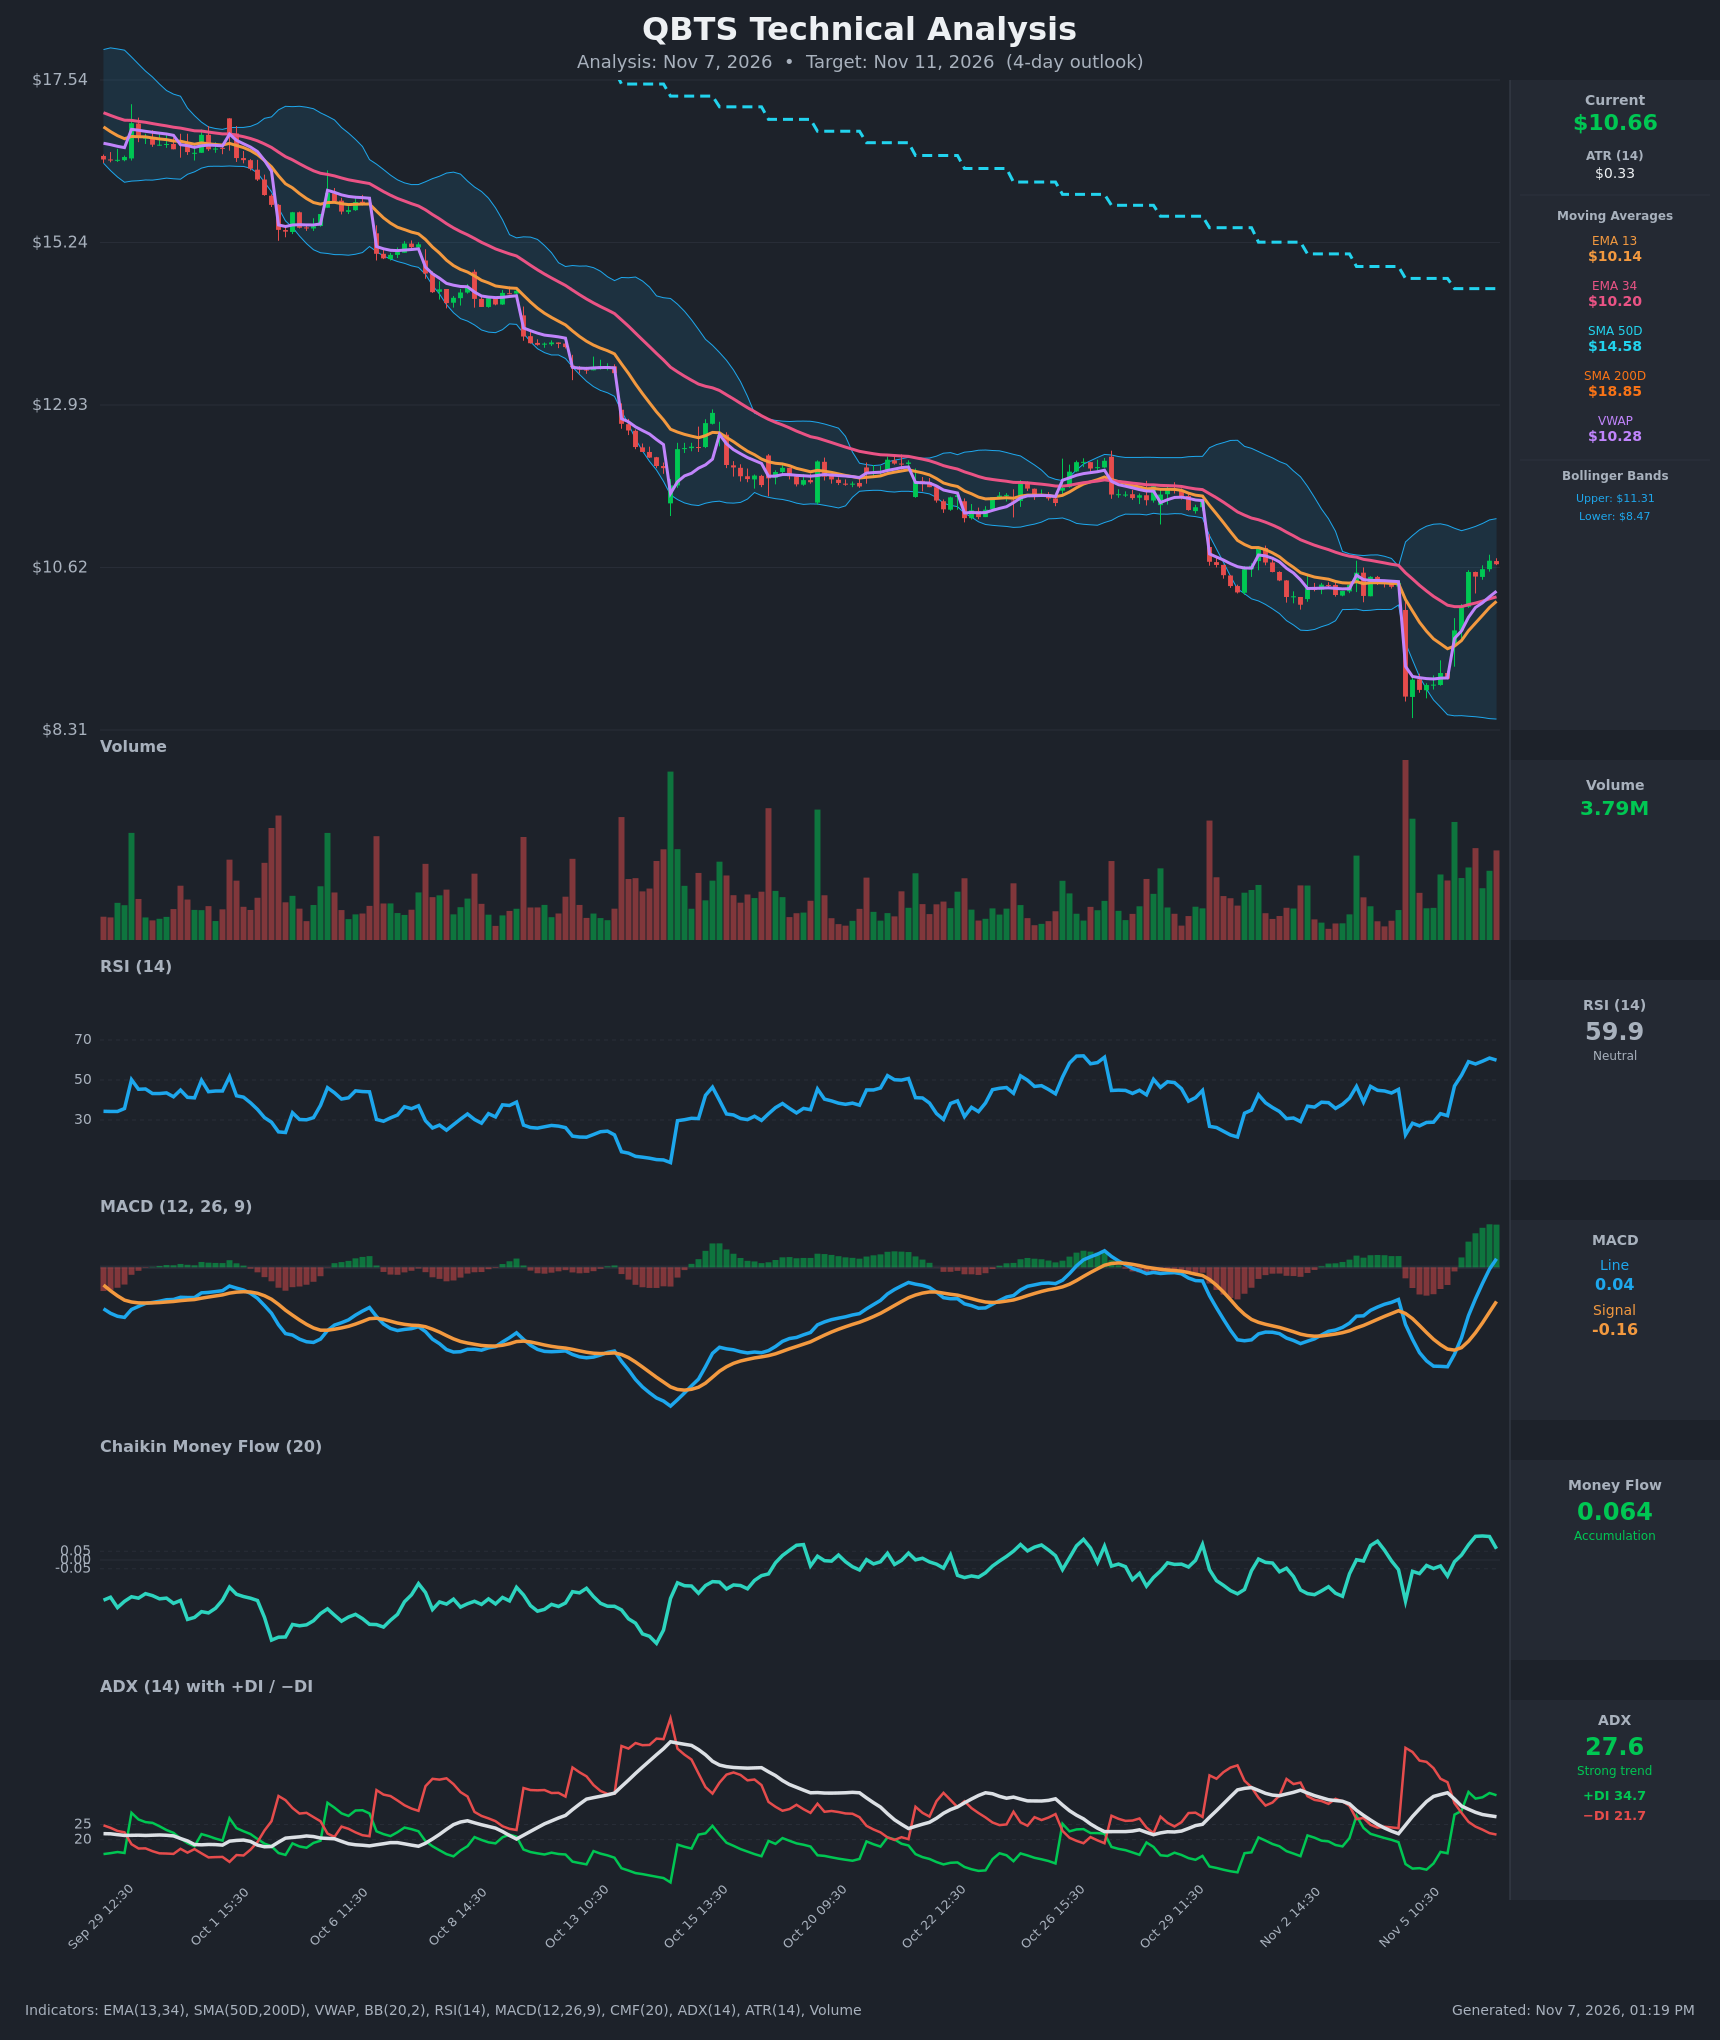
- RSI (14): 59.93, up sharply from a 22.6 oversold low on Nov 5 and now holding in the upper-neutral zone. Momentum is clearly rising but not yet overbought (70). [Bullish]
- 20 EMA (EMA 13/34 used): Price of $10.665 is above EMA 13 ($10.138) and EMA 34 ($10.202). The EMA 13 just crossed above the EMA 34 in the last bar (9.94 vs 10.14 earlier, now 10.14 vs 10.20, so it is closing in but not yet crossed). Both now sit just below price as near-term support. [Bullish]
- MACD: Line +0.040 has crossed above the signal at -0.159. The histogram is positive and expanding, which is a fresh bullish crossover. The lines are still near the zero line, so the move is early. [Bullish]
- Bollinger Bands (20): Upper $11.31, lower $8.47, with price at $10.665 just above the midline (~$9.89). The bands are wide after the Nov 5 flush. Price has room toward the upper band (~$0.65 away), and a bounce from the lower band has already played out. [Bullish]
- CMF (20): +0.064 is above the +0.05 threshold, indicating mild accumulation. It has been positive for several bars but ticked down from 0.137, so buying pressure is fading slightly. [Accumulation]
- ADX (14): 27.6 with +DI 34.7 above −DI 21.7. The +DI/−DI crossover happened Nov 6 and bulls are in control. ADX is falling from 35.5, which reflects the old downtrend losing strength while the new up-move is still young. [Strong Trend + Bullish direction]
- Volume: 3.79M, elevated on the recent up bars after a huge capitulation-volume spike on Nov 5. Rising volume on the rebound supports the bounce. [Supportive of bounce]
DIVERGENCES & TRENDS
- The long-term trend is firmly bearish. Price is far below SMA50D ($14.58) and SMA200D ($18.85). The death cross is already in place, since the SMA50 sits well below the SMA200.
- RSI made a higher low relative to the Nov 5 price flush, and it has since moved from 22 to 60. This is a sharp momentum recovery rather than a classic divergence.
- MACD crossed above its signal on Nov 6 (-0.008 vs -0.209 at 14:30, then +0.040 vs -0.159 at 15:30). This is a fresh bullish signal.
- Price has reclaimed VWAP ($10.28) and both EMAs. The reclaim of the prior breakdown level (~$10.4) is notable.
- The CMF decline from 0.137 to 0.064 shows buying pressure cooling slightly at the highs.
- Overhead supply sits at $11.3 (upper Bollinger Band) and the earlier $11.5-12 consolidation zone. The SMA50 is a distant resistance.
CHART PATTERNS
- V-shaped reversal / capitulation: The Nov 5 gap-down to ~$8.79 on huge volume was followed by a rapid recovery. It most resembles a Bullish Falling Wedge / Expanding Triangle exhaustion from the reference. This is a counter-trend bounce within a larger downtrend.
- The recovery has retaken the breakdown level (~$10.4). Measured resistance sits at the pre-gap area of ~$11.3-11.5, roughly 6-8% above current price.
- No confirmed continuation pattern is present. The risk is a bearish flag or pennant forming under $11.3, which would be a bearish continuation of the larger downtrend.
POTENTIAL SCENARIOS
- Scenario 1: Bullish Continuation of the Relief Bounce — Momentum (MACD cross, +DI dominance, CMF positive) carries price toward the upper Bollinger Band. Trigger: hold above $10.40 (EMA/VWAP cluster) and break above $10.90. Target: $11.20-$11.35. Invalidation: close below $10.15. (50% probability)
- Scenario 2: Neutral Consolidation Under Resistance — Price stalls between VWAP/EMAs and the $11.3 band, digesting the sharp bounce. Trigger: failure to break $11.0 with fading volume. Target: $10.30-$10.90. Invalidation: break outside either bound on volume. (25% probability)
- Scenario 3: Bearish Rejection and Fade — The bounce fails at overhead supply and the larger downtrend resumes. Trigger: loss of $10.28 VWAP and EMA cluster. Target: $9.70-$9.90. Invalidation: close above $11.35. (25% probability)
PRICE TARGETS
- Target Price: $10.95 (4-day horizon)
- Expected Range: $10.10 to $11.55 (width $1.45, about 13.6% of current price. This is slightly wider than the usual 4-day guide, which is justified by the elevated volatility after the Nov 5 gap, with ATR at $0.33.)
- Key Levels: Support at $10.28 (VWAP, with EMAs just below at $10.14-$10.20), Resistance at $11.31 (upper Bollinger Band)
OVERALL BIAS
OVERALL BIAS: BULLISH - A fresh MACD bullish crossover, +DI over −DI, price reclaiming VWAP and both EMAs, positive CMF and a recovering RSI favor further upside toward the $11.3 band. The larger downtrend (price below both SMAs) caps conviction.
This is educational analysis and not financial advice.