QBTS 7-day bullish forecast — Nov 7, 2026
- Bias: Bullish
- Timeframe: 7 days (made Nov 7, 2026, target date Nov 13, 2026)
- Price at analysis: $10.66
- Price target: $11.05
- Expected range: $10.30 – $11.15
- Result: Incorrect (-12.2%) — closed at $9.37 on Nov 13, 2026; quality score 0/100
Get a free AI analysis of QBTS today
Analysis
TECHNICAL INDICATORS
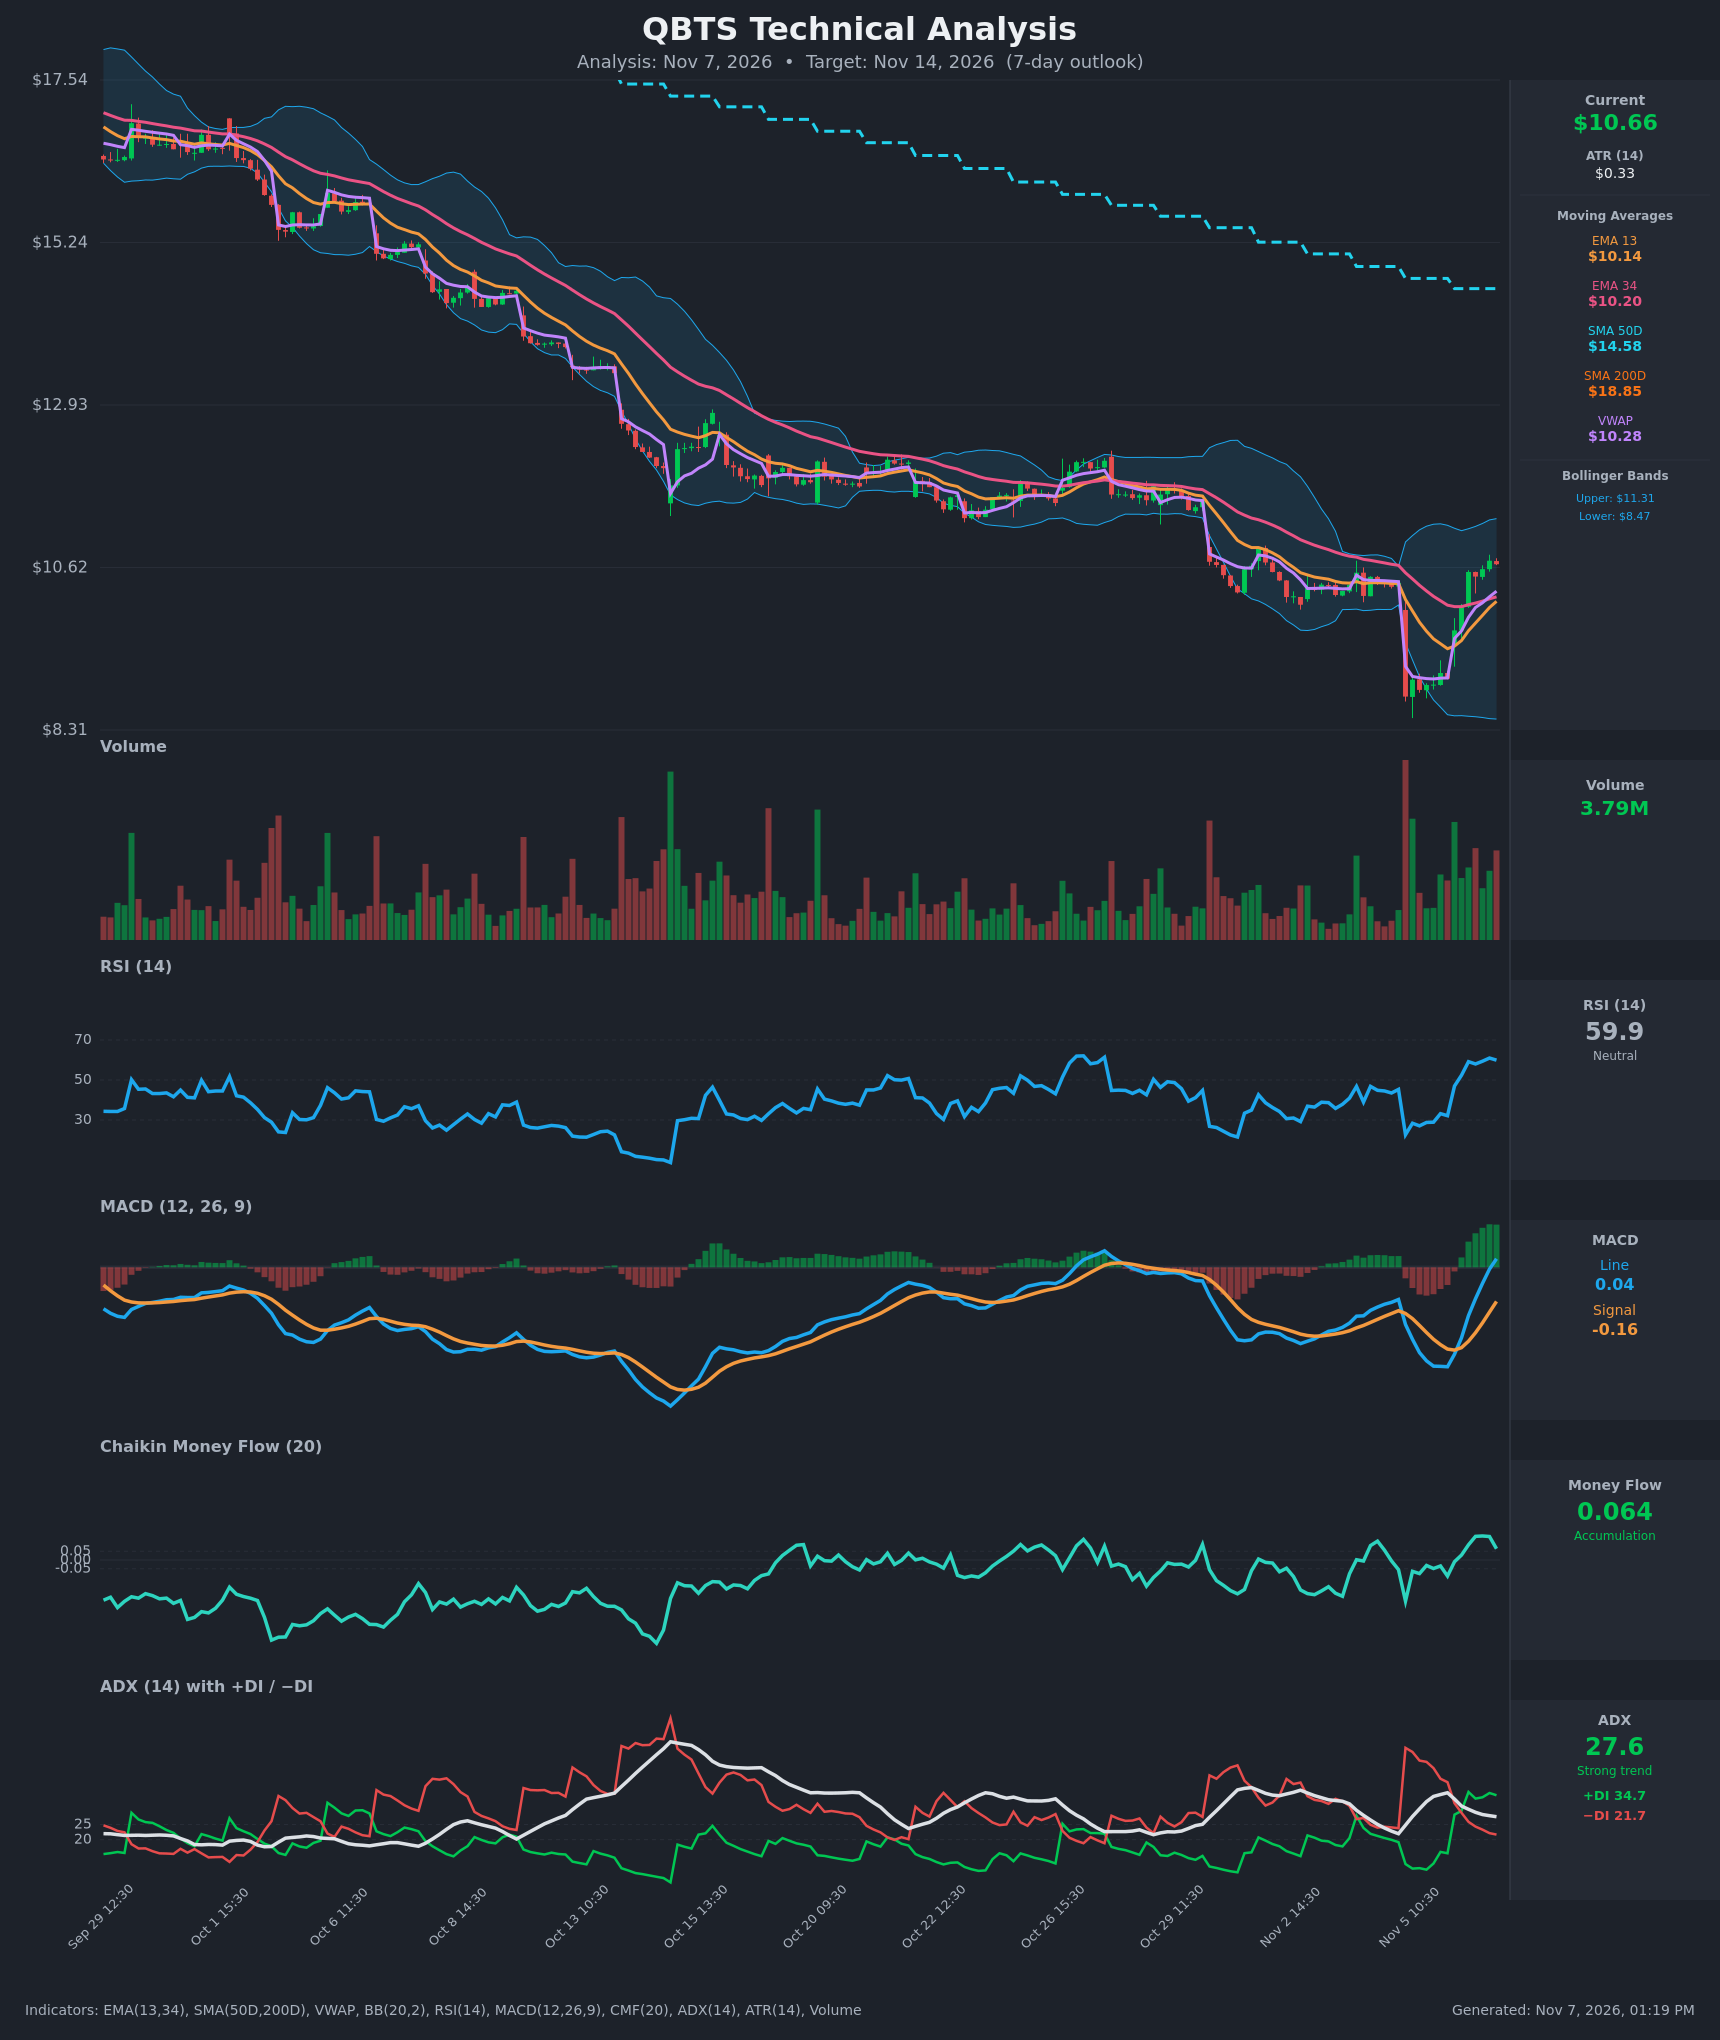
- RSI (14): 59.9, up sharply from the 22.6 oversold low on Nov 5. It is approaching the 70 overbought line but has room, and it has flattened slightly over the last few bars (61.0 to 59.9). [Bullish]
- 20 EMA: The supplied data gives EMA 13 at $10.14 and EMA 34 at $10.20. Price at $10.67 is above both, so the short averages act as support. EMA13 is still just below EMA34 but the gap is closing fast (a bullish cross is imminent). Both are sloping upward after bottoming. [Bullish]
- MACD: The line (0.040) just crossed above the signal (-0.159) on the last bar, and the histogram has flipped positive and is expanding. The zero line has been reclaimed. This is a fresh bullish crossover from deeply negative territory. [Bullish]
- Bollinger Bands (20): Upper $11.31, lower $8.47, mid roughly $9.89. The bands are wide after the Nov 5 flush. Price has moved from the lower band to the upper half and sits about $0.65 below the upper band. There is room to run, though upper-band tagging often triggers pauses. [Bullish]
- CMF (20): 0.064, just above the +0.05 accumulation threshold. It peaked near 0.137 and has faded, so buying pressure is positive but weakening. [Accumulation]
- ADX (14): 27.6 with +DI 34.7 above −DI 21.7. This is a strong trend that is now bullish-led after the DI crossover on Nov 6. ADX is rolling over from 35.5, so the old bearish trend strength is fading and the new bullish move is not yet confirmed by a rising ADX. [Strong Trend, Bullish direction]
- Volume: 3.79M, solid and in line with recent bars. The gap-down bar on Nov 5 had the largest volume, and the rebound bars show above-average green volume, which suggests absorption and buying on the bounce. [Moderately Bullish]
DIVERGENCES & TRENDS
- Trend structure: The long-term trend is still clearly bearish. Price is below SMA50 ($14.58) and SMA200 ($18.85). SMA50 is below SMA200, so the death cross is already in place, and the SMA50 is still falling.
- Short-term shift: Momentum has turned up from extreme oversold (RSI 22.6). Price reclaimed VWAP ($10.28), EMA13 and EMA34 within a day.
- Crossovers: The MACD bullish cross just occurred, and +DI crossed above −DI on Nov 6. EMA13 is about to cross above EMA34, with the gap down to about $0.06.
- Divergence: There is no clean price/RSI divergence, but CMF is lower than its recent peak while price is still rising. This is a mild warning of waning accumulation. ADX is also falling while price rises, which is typical of a trend transition rather than a confirmed new trend.
- Gap fill: Price has recovered to the pre-gap level of about $10.40–$10.65, so the gap down is effectively filled. That level is now a pivot.
CHART PATTERNS
- V-shaped reversal from a sharp flush: The move resembles the bullish falling wedge / bullish reversal family from the reference diagram. The wedge formed over the multi-week downtrend, and the Nov 5 spike low at about $8.79 acted as a capitulation. The breakout above the descending trend line is the signal.
- Resistance zones: The prior consolidation area at $11.3–$11.5 (late Oct) also matches the upper Bollinger Band at $11.31. A close above it would open the next target near $12.0–$12.5, though this is outside the 7-day expectation.
- Counter-trend risk: This could instead be a bear-market rally within the larger downtrend (a bearish flag, in the reference's continuation family). A failure back below $10.14 would argue for that.
POTENTIAL SCENARIOS
- Scenario 1: Bullish Continuation Toward the Upper Band — The MACD and DI crossovers hold, EMA13 crosses above EMA34, and price pushes toward the late-October resistance and upper Bollinger Band. Trigger: hourly closes above $10.90 with volume above 3.5M. Target: $11.05–$11.30. Invalidation: a close below $10.14 (EMA13 and VWAP zone). (50% probability)
- Scenario 2: Bearish Rollover Within the Larger Downtrend — The bounce stalls below $11, CMF fades below zero, and the sellers who control the long-term trend reassert themselves, sending price back to fill the lower part of the rebound. Trigger: a close below $10.14 and MACD re-crossing under its signal. Target: $9.60–$9.90. Invalidation: a close above $11.31. (33% probability)
- Scenario 3: Neutral Consolidation Above the EMAs — Price digests the 20% bounce between $10.20 and $11.00 as ADX continues to drop. Trigger: low-volume, overlapping candles. Target: $10.40–$10.90. Invalidation: a break outside the $10.14–$11.31 band. (17% probability)
PRICE TARGETS
- Target Price: $11.05 (7-day)
- Expected Range: $10.30 to $11.15. The width is $0.85, about 8.0% of the current price, in line with the 7–10 day guidance.
- Key Levels: Support at $10.14 (EMA13 / VWAP zone), Resistance at $11.31 (upper Bollinger Band / prior consolidation)
OVERALL BIAS
OVERALL BIAS: BULLISH - A fresh MACD bullish crossover, +DI above −DI, price reclaiming all short-term EMAs and VWAP, and CMF in accumulation after an oversold flush favor a further push toward $11. Conviction is modest because price remains well below the falling SMA50 and SMA200, and CMF and ADX are fading.
This is educational analysis and not financial advice.