SMH 7-day bearish forecast — Nov 7, 2026
- Bias: Bearish
- Timeframe: 7 days (made Nov 7, 2026, target date Nov 13, 2026)
- Price at analysis: $463.73
- Price target: $455.00
- Expected range: $434.00 – $478.00
- Result: Incorrect (+3.7%) — closed at $481.00 on Nov 13, 2026; quality score 28/100
Get a free AI analysis of SMH today
Analysis
TECHNICAL INDICATORS
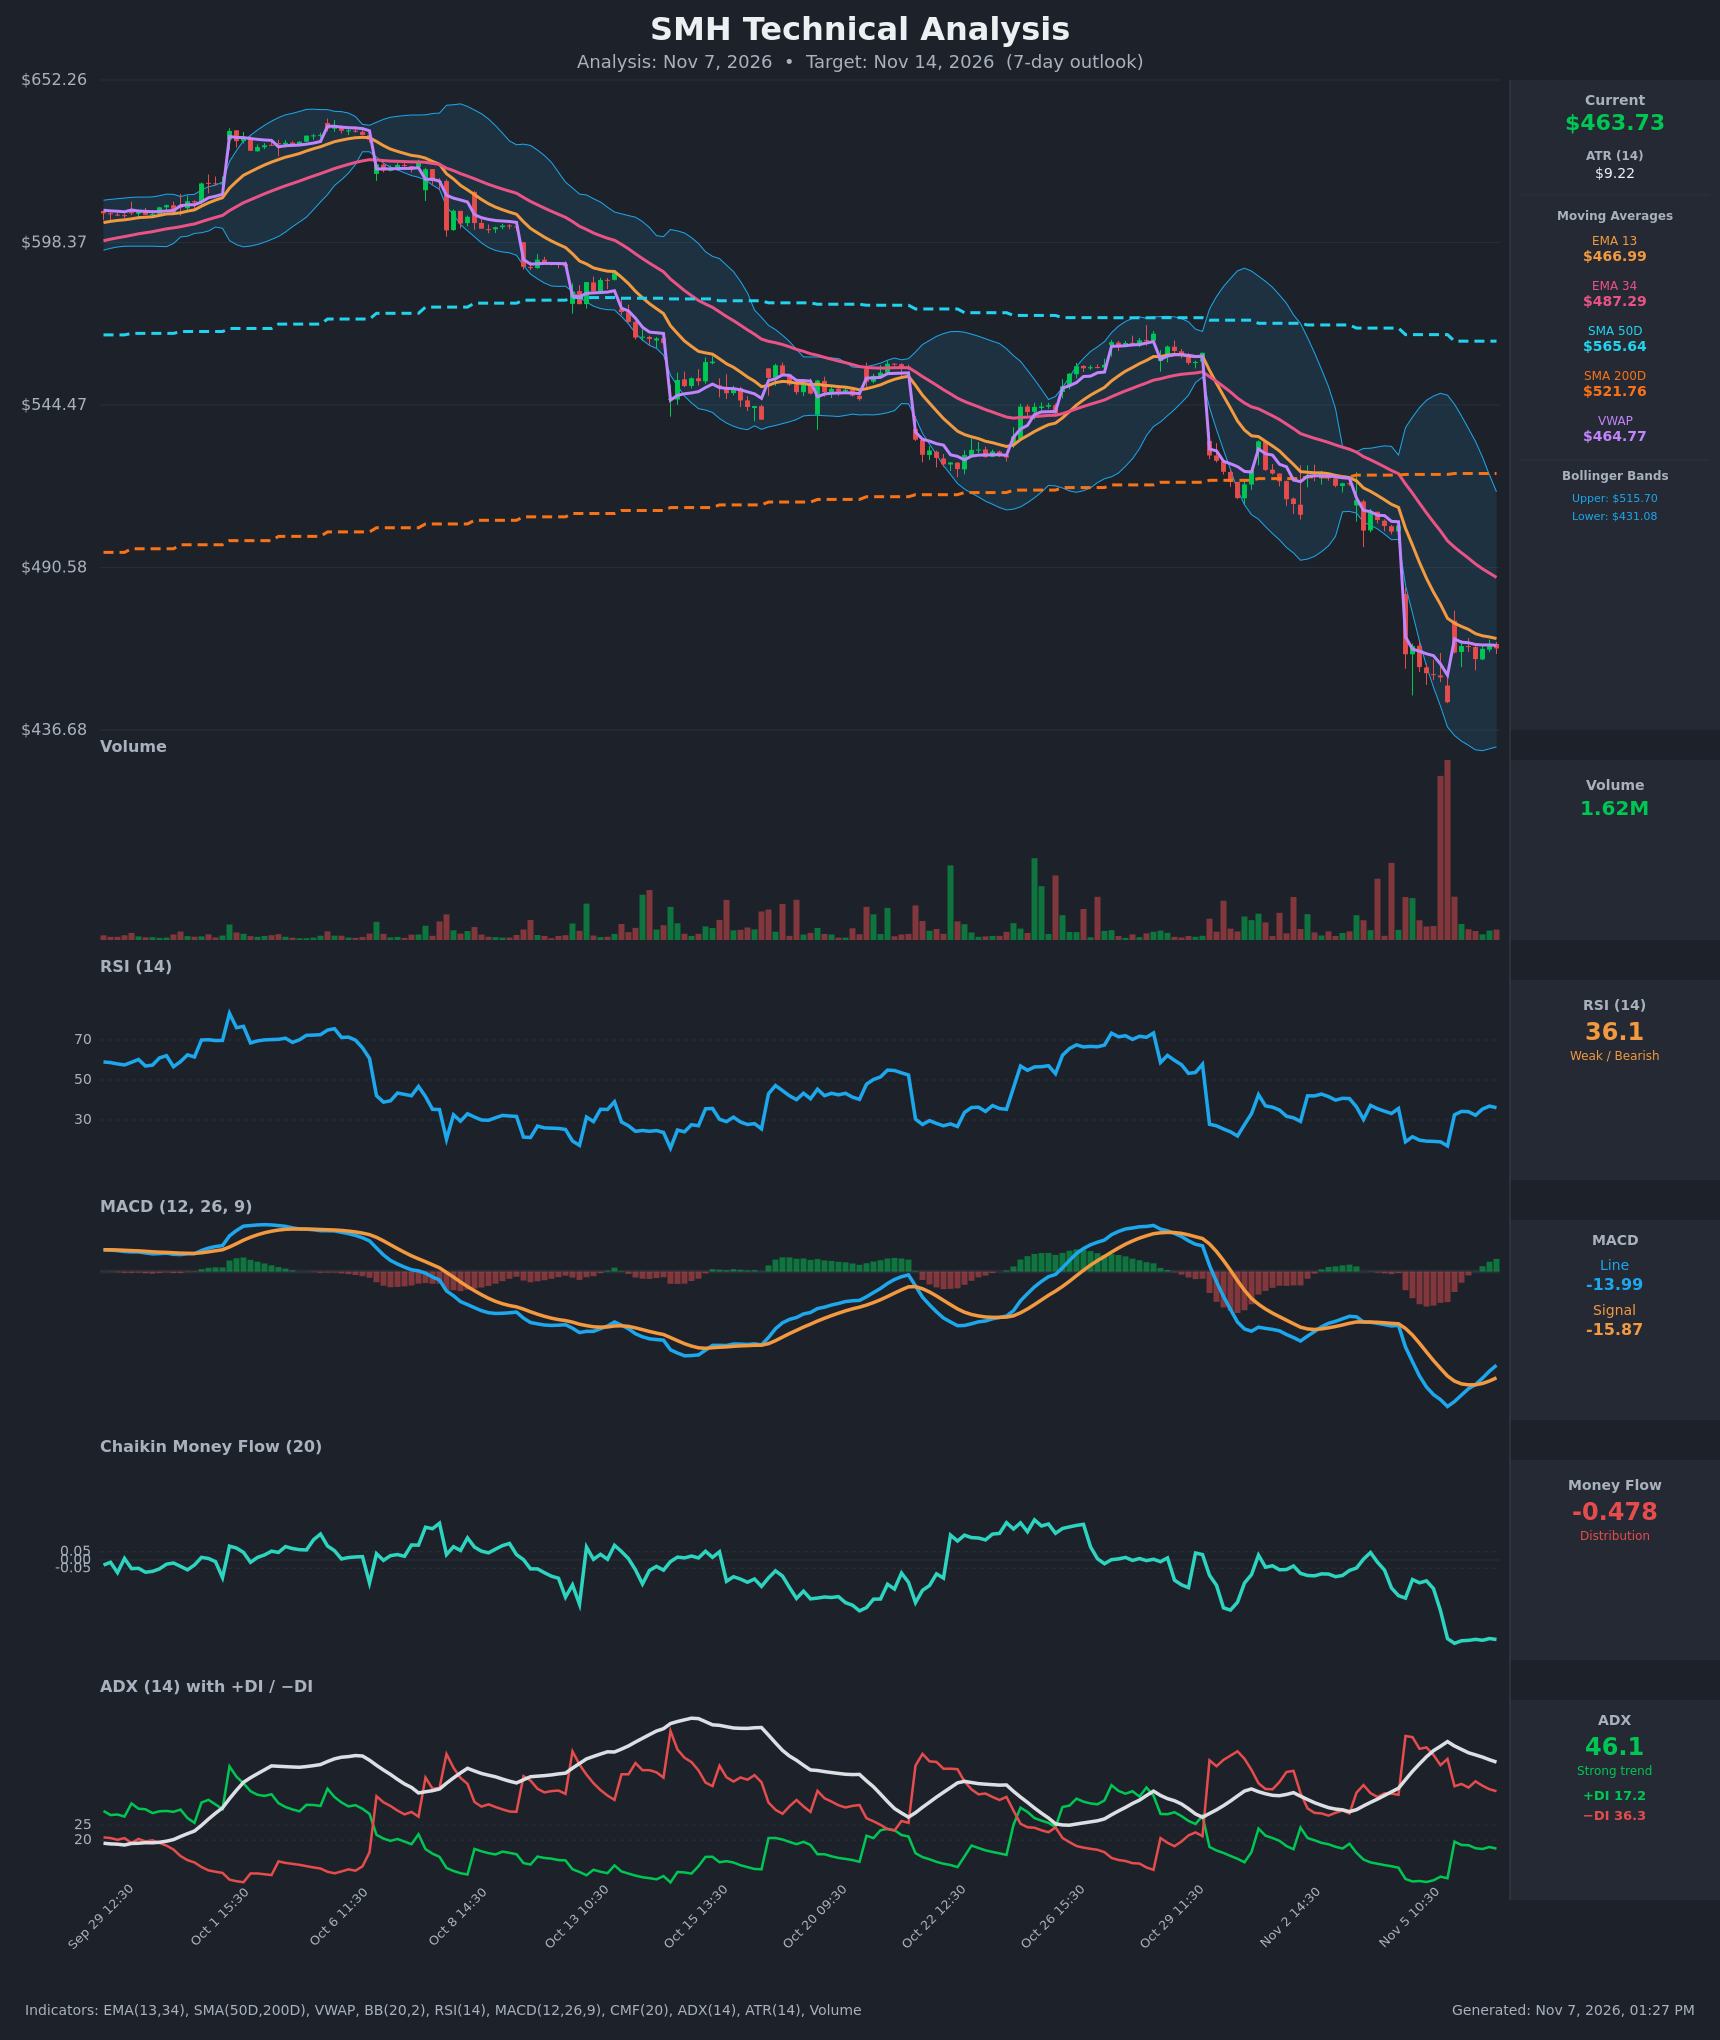
- RSI (14): 36.1, below 50 and near oversold territory. It has recovered from a 17.0 low on Nov 5 and is stabilizing in the mid-30s. Momentum is weak but the downside push is fading. [Bearish]
- EMA (13/34): EMA13 is $466.99 and EMA34 is $487.29. Price at $463.73 is below both, and EMA13 is below EMA34 (bearish alignment). Price is only about 0.7% under EMA13, so the short-term average is the first overhead resistance, with EMA34 next. [Bearish]
- MACD: Line at -13.99, signal at -15.87, histogram about +1.9. The line crossed above the signal on Nov 6 (12:30) while both remain deeply negative. This is a bullish momentum turn, but it is a relief bounce inside a downtrend. [Neutral]
- Bollinger Bands (20): Upper $515.70, lower $431.08, middle about $473. Price is in the lower half of the bands, below the midline. The bands are wide after the Nov 5 gap-down, and price has bounced off the lower band area. [Bearish]
- CMF (20): -0.478, deep distribution well below -0.05. It has sat at extreme negative levels since the Nov 5 selloff, with no sign of accumulation. [Distribution]
- ADX (14): 46.1 with −DI (36.3) far above +DI (17.2). ADX has rolled over from a 52.9 peak, which suggests the trend is maturing, but it is still a very strong downtrend controlled by sellers. [Strong Trend – Bearish]
- Volume: 1.62M on the latest bar, far below the spike during the Nov 5 gap-down. Volume has dried up during the consolidation near $462–465, so the bounce lacks buying conviction. [Capitulation spike followed by low-volume base]
- VWAP/SMAs: VWAP is $464.77, and price is hugging it and slightly below. SMA50D ($565.64) is above SMA200D ($521.76) with price well below both, so there is no death cross yet but the long-term structure is damaged. [Bearish]
DIVERGENCES & TRENDS
- Bullish divergence (short-term): Price made a lower low on Nov 5 (about $445.91), and RSI and MACD have since turned up. Price is holding $460–465 on a MACD bullish crossover.
- Trend: The downtrend is clear, with lower highs and lower lows since the late-Oct peak around $560–570, and price is below all key averages.
- Gap and range: A large gap-down on Nov 5 (from about $504 to $462) was followed by a tight, low-volume consolidation around $455–465.
- Crossovers: The bullish MACD crossover is the only positive signal. −DI is still dominant and CMF is at an extreme low.
- Overhead resistance: The gap zone ($490–504), EMA34 ($487) and SMA200D ($521) all cap rallies.
CHART PATTERNS
- Bearish Flag/Pennant (continuation): After the sharp drop, price is consolidating in a tight, low-volume range just below EMA13. This fits the bearish flag/pennant from the reference diagram. A break below about $455 would project a measured move toward $430, roughly the lower Bollinger Band.
- Possible falling wedge / double bottom (reversal): The $446 low and the retest area around $455–460 could form a base, but it is not confirmed. A move above $467–470 (EMA13 and the top of the range) would be the first sign.
- Gap-down: Unfilled gap overhead at $490–504 acts as resistance.
POTENTIAL SCENARIOS
- Scenario 1: Bearish Flag Breakdown — The consolidation resolves lower as sellers (−DI 36, CMF -0.48) regain control and price loses the Nov 5–6 base. Trigger: close below $455, with a break of the $446 low as confirmation. Target: $436–$440, then the lower band near $431. Invalidation: close above $472 (EMA13 and the band midline). (50% probability)
- Scenario 2: Bullish Relief Bounce — Oversold RSI, the MACD cross and the bullish divergence fuel a mean-reversion rally toward the EMA34 and gap zone. Trigger: break above $467–470 on rising volume. Target: $485–$490. Invalidation: loss of $455. (32% probability)
- Scenario 3: Neutral Range Consolidation — Price chops between $452 and $472 as the ADX cools. Trigger: low-volume drift around VWAP. Target: $460–$468. Invalidation: close outside $450–$475. (18% probability)
PRICE TARGETS
- Target Price: $455.00 (7-day)
- Expected Range: $434.00 to $478.00 (width $44 ≈ 9.5% of current price; consistent with ~4–8% guidance, widened slightly because ATR is $9.22 and the market is volatile)
- Key Levels: Support at $446.00, Resistance at $472.00
OVERALL BIAS
OVERALL BIAS: BEARISH - Price is below all key moving averages with −DI dominant, ADX at 46, and CMF at -0.48 showing heavy distribution. The low-volume consolidation looks like a bearish flag, and the MACD crossover is only a modest relief signal within the downtrend.
This is educational analysis and not financial advice.