SMH 4-day bearish forecast — Nov 7, 2026
- Bias: Bearish
- Timeframe: 4 days (made Nov 7, 2026, target date Nov 10, 2026)
- Price at analysis: $463.73
- Price target: $458.00
- Expected range: $447.00 – $468.00
- Result: Incorrect (+5.4%) — closed at $488.88 on Nov 10, 2026; quality score 0/100
Get a free AI analysis of SMH today
Analysis
TECHNICAL INDICATORS
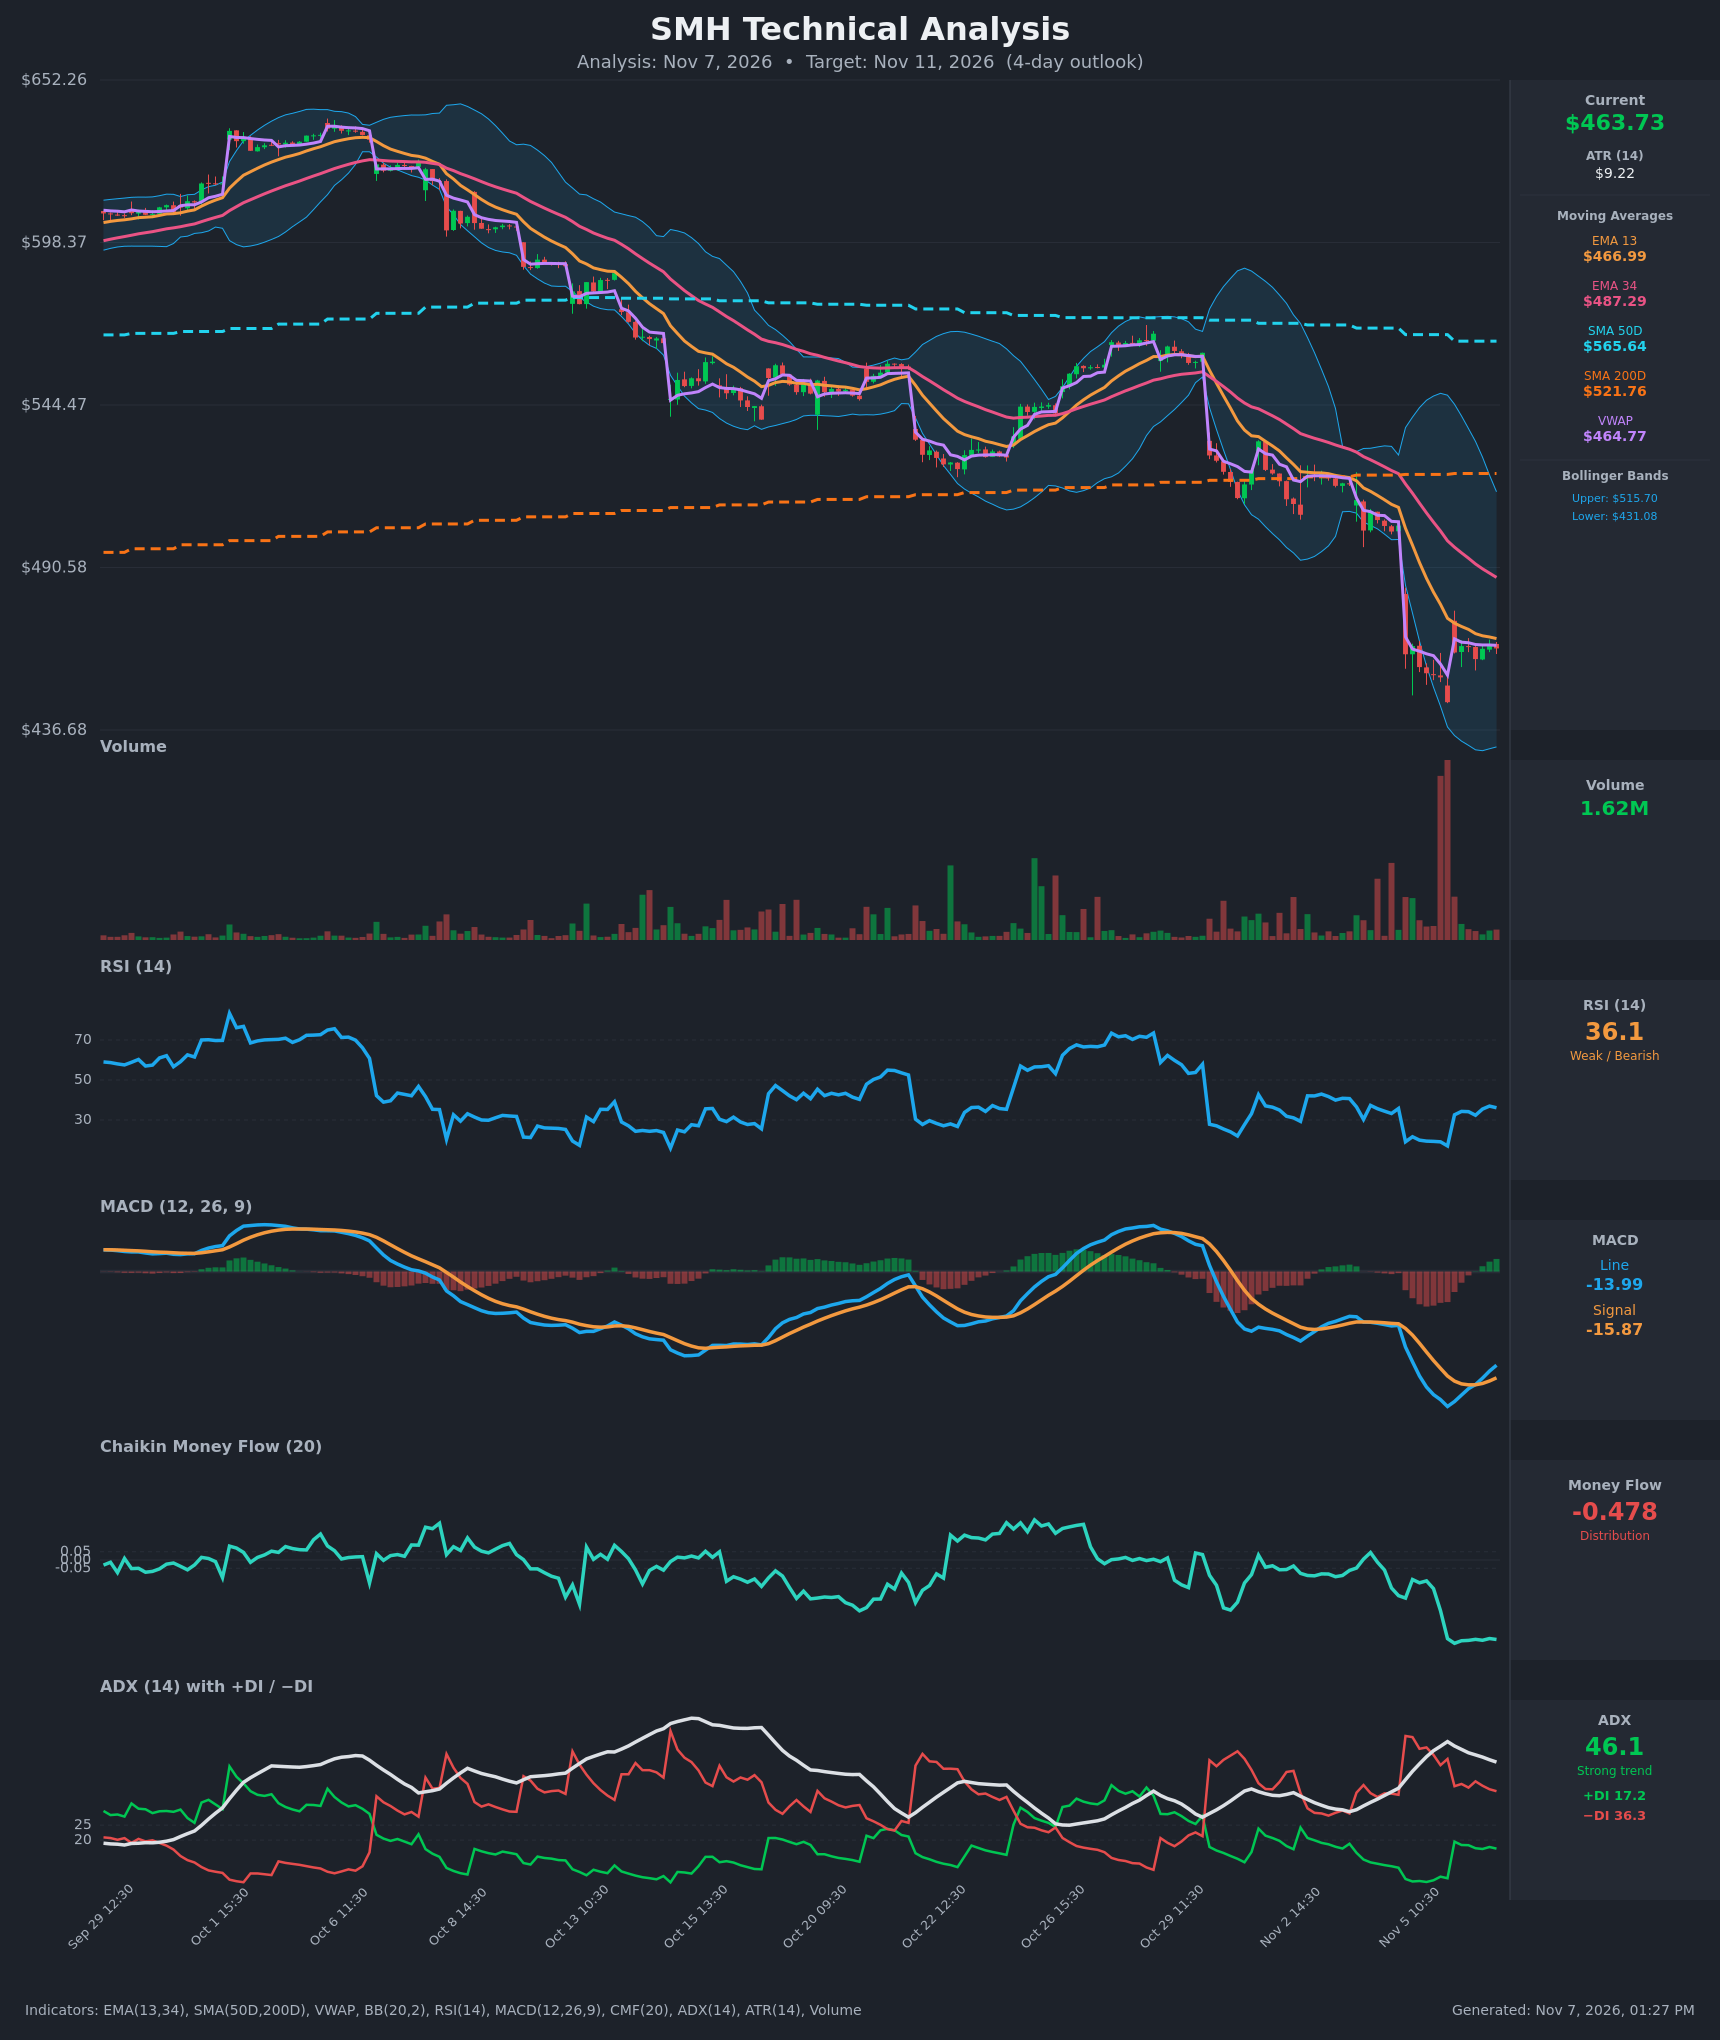
- RSI (14): 36.12. It bounced from a deeply oversold 17.0 on Nov 5 and has stalled in the 32-37 zone. It is still below 40, so momentum is weak, though the recovery from the low is a modest positive. [Bearish]
- 20 EMA (EMA 13 / EMA 34 used): EMA 13 is $466.99 and EMA 34 is $487.29. Price at $463.73 is below both, and EMA 13 sits just overhead as first resistance. EMA 13 is well below EMA 34, so the bearish crossover is long established and both slopes are still falling. [Bearish]
- MACD: Line -13.99 is above Signal -15.87, so the histogram is +1.88. The line crossed up on Nov 6 around 12:30-13:30 and is rising from a deep trough. This is a bullish momentum turn, but it happens well below zero and is more a relief bounce than a trend reversal. [Bullish]
- Bollinger Bands (20): Upper $515.70, lower $431.08, midline about $473. Price is in the lower half, about 39% of the way up the band. The bands are wide after the Nov 5 gap-down, so volatility is high. Price has stopped walking the lower band and is consolidating, which suggests some selling exhaustion, but it is still below the midline. [Bearish]
- CMF (20): -0.478, deep distribution, far below the -0.05 threshold and not improving over the last 15 bars. It shows heavy, persistent selling pressure with no sign of accumulation. [Distribution]
- ADX (14): 46.1 with −DI 36.3 above +DI 17.2. This is a strong downtrend. ADX has eased from 52.9 and −DI has pulled back from 54.8, so the downtrend is losing some intensity, but the bears are still firmly in control. [Strong Trend – Bearish]
- Volume: The current bar is 1.62M, light compared with the huge capitulation spike on the Nov 5 gap. Volume dried up during the sideways consolidation, so the bounce attempt has no real buying participation. [Bearish – weak bounce volume]
DIVERGENCES & TRENDS
- Possible bullish divergence: Price is flat to slightly lower, retesting the $455-465 zone, while RSI (17 → 36) and MACD (-20.2 → -14.0) made higher readings. This is a short-term momentum divergence, but it hasn't been confirmed by price or CMF.
- CMF confirms the downtrend: CMF at -0.478 is the lowest of the whole chart, with no divergence.
- Moving averages: EMA 13 < EMA 34 < SMA 200D ($521.76) < SMA 50D ($565.64). Price is below the SMA 200D, and the SMA 50D is above the SMA 200D, so this is a deteriorating long-term structure with a possible death cross ahead.
- VWAP: Price ($463.73) is essentially at VWAP ($464.77), so buyers and sellers are balanced after the gap.
- Crossovers: MACD recently crossed bullish (small and low). There has been no DI crossover; −DI remains roughly double +DI.
- Gap: The Nov 4 → Nov 5 gap from $504 to $462 remains unfilled, and price has gone sideways for about 2 days beneath it.
CHART PATTERNS
- Bearish Pennant / Bearish Flag (continuation): After the sharp drop from $504 to $446-462, price has gone sideways in a tight $455-465 band with a slightly rising floor. This resembles a bearish flag/pennant. A break below about $455 projects the measured move down toward the $440s or lower (the pole was about $45-58).
- Descending channel context: The multi-week pattern of lower highs ($640 → $560 → $535) is a bearish structure, and the 15-minute-scale consolidation sits at the bottom of it.
- Bullish counter-case: An oversold base with RSI/MACD divergence could be the start of a Bullish Double Bottom (lows near $446 and $455-460). That would need a close above about $467-470 (EMA 13 / VWAP area) to confirm.
POTENTIAL SCENARIOS
- Scenario 1: Bearish Flag Breakdown — The consolidation resolves lower in line with the strong ADX trend and heavy distribution. Trigger: hourly close below $455. Target: $446, then $440 (low end of the expected range around $447). Invalidation: hourly close above $469. (45% probability)
- Scenario 2: Bullish Oversold Relief Bounce — The MACD cross and RSI divergence lead to a short-covering bounce toward the declining EMA 13 and the gap zone. Trigger: hourly close above $467-469 on rising volume. Target: $475-$483 (BB midline, partial gap fill, EMA 34 near $487). Invalidation: loss of $455. (35% probability)
- Scenario 3: Neutral Continued Consolidation — Price chops between $455 and $467 as ADX cools. Trigger: no break of either boundary. Target: $458-$466. Invalidation: close outside the $455-$467 range. (20% probability)
PRICE TARGETS
- Target Price: $458.00 (4-day horizon, Nov 11)
- Expected Range: $447.00 to $468.00 (width $21.00, about 4.5% of current price, appropriate for a 4-day window)
- Key Levels: Support at $455.00 (consolidation floor, then $445.91 recent low), Resistance at $467.00 (EMA 13 / VWAP zone, then $487.29 EMA 34)
OVERALL BIAS
OVERALL BIAS: BEARISH - Price is below every moving average with ADX at 46 and −DI at about twice +DI, CMF at -0.478 shows heavy distribution, and the sideways consolidation looks like a bearish flag under an unfilled gap. The MACD upturn and RSI recovery argue for a bounce risk, but the bounce lacks volume, so a modest downside bias is favored.
This is educational analysis and not financial advice.