DELL 4-day bearish forecast — Nov 7, 2026
- Bias: Bearish
- Timeframe: 4 days (made Nov 7, 2026, target date Nov 10, 2026)
- Price at analysis: $328.58
- Price target: $322.00
- Expected range: $302.00 – $345.00
- Result: Incorrect (+1.8%) — closed at $334.38 on Nov 10, 2026; quality score 36/100
Get a free AI analysis of DELL today
Analysis
TECHNICAL INDICATORS
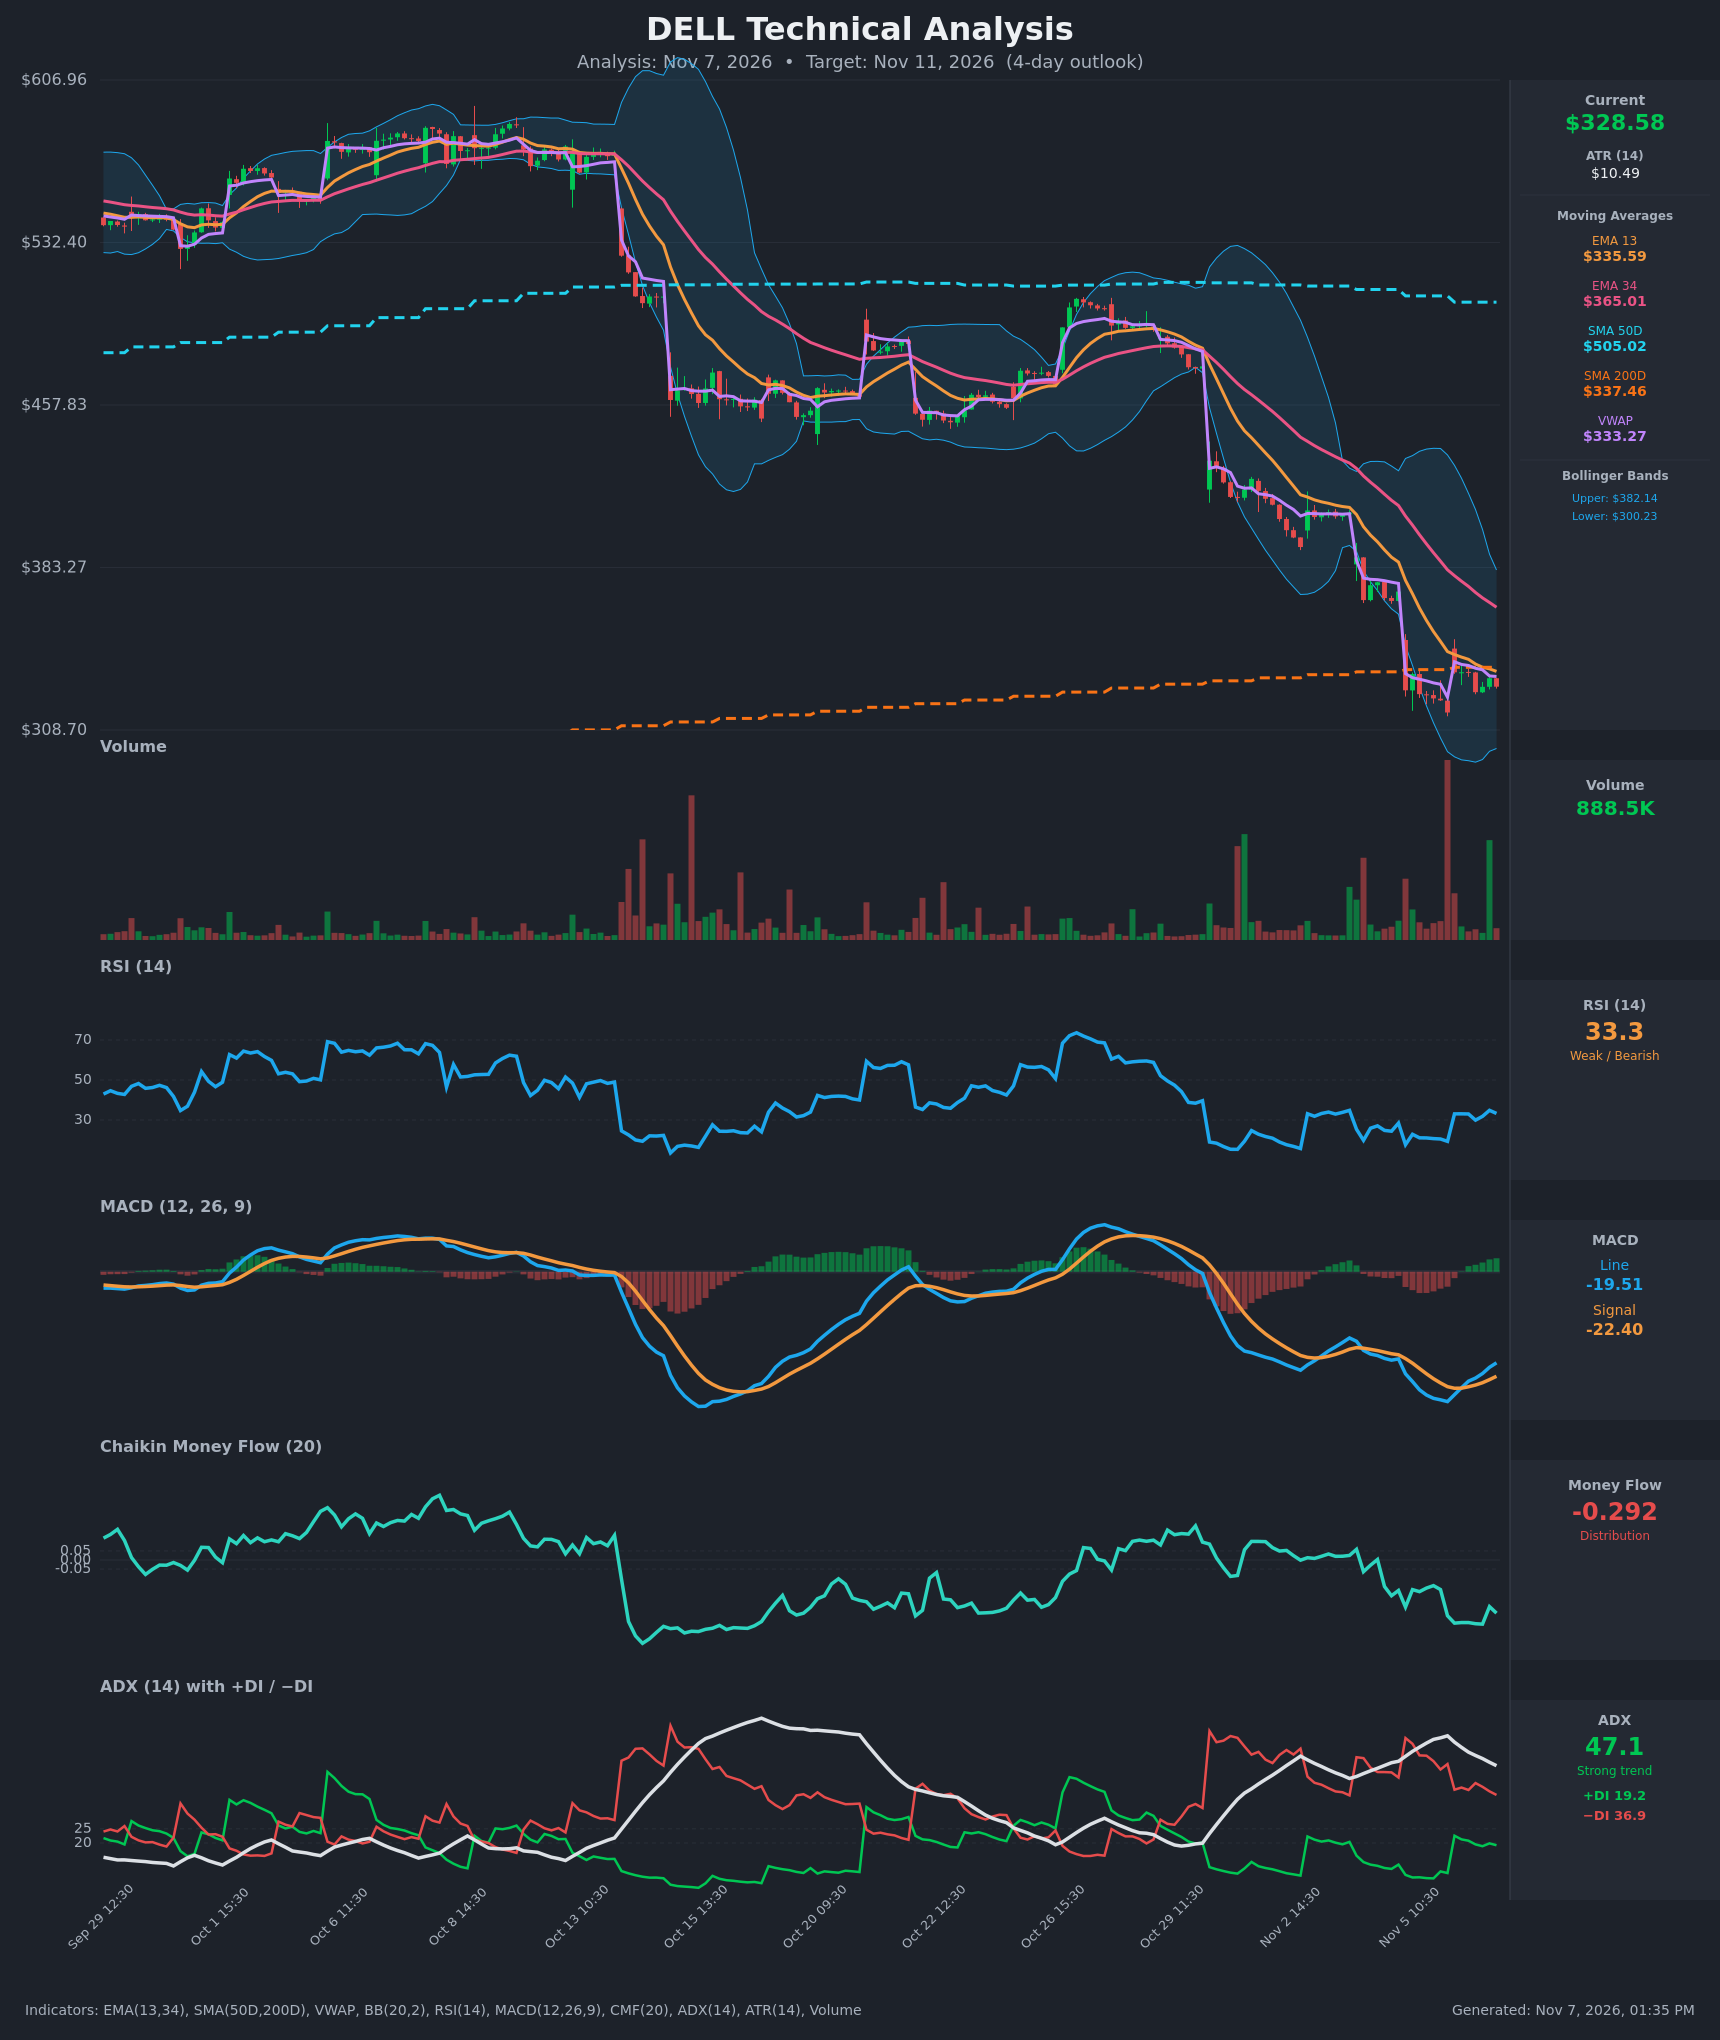
- RSI (14): 33.28, just above the oversold line at 30. It has recovered from the 17-20 extreme lows on Nov 5 but has stalled in the low 30s. Momentum is weak with no bullish regime shift. [Bearish]
- 20 EMA: The chart shows EMA 13 at $335.59 and EMA 34 at $365.01. Price at $328.58 is below both, so they act as resistance. EMA 13 is still sloping down, and EMA 13 is far below EMA 34, a bearish alignment. [Bearish]
- MACD: Line -19.51 is above Signal -22.40, so there was a bullish crossover on Nov 6 and the histogram is positive and rising. This is a modest momentum bounce, but both lines are deeply negative below zero. [Neutral]
- Bollinger Bands (20): Upper $382.14, lower $300.23, middle about $341. Price at $328.58 is in the lower half, below the midline. The bands are wide after a violent selloff. Price has bounced off the lower band, but the midline is overhead resistance. [Bearish]
- CMF (20): -0.292, well below -0.05. This shows persistent distribution and heavy selling pressure, with no recovery toward zero. [Distribution]
- ADX (14): 47.1 and falling from a peak of about 57.6, with -DI 36.9 above +DI 19.2. The downtrend is very strong but may be maturing as ADX cools and +DI recovers from 8-10. [Strong Trend - Bearish]
- Volume: 888.5K on the latest bar, moderate compared with the heavy spikes during the Nov 5 plunge. There was a large green volume bar on the last bar of the chart, which hints at some dip buying. The bounce is on lighter volume than the selloff. [Mixed / Selling exhaustion possible]
DIVERGENCES & TRENDS
- MACD vs. price: MACD made a higher low (-27.8 vs. earlier lows) and crossed above Signal while price sits near its lows. This is an early bullish momentum divergence, but it is not confirmed by CMF.
- RSI: After the 17.7 extreme, RSI has stabilized at 30-35. It has not broken above 40, so the bounce is weak.
- Moving averages: SMA50D ($505) is far above SMA200D ($337). The SMA50D was falling and the spread is narrowing, which means a death cross is not imminent, but the 50D is falling. Price is below SMA200D ($337.46), a loss of long-term support that now acts as resistance. Both EMA 13 and VWAP ($333.27) sit just above price.
- ADX/DI: -DI remains dominant, but ADX is rolling over. This usually means trend deceleration and a consolidation or relief bounce, not a reversal.
- CMF: It has been persistently negative since mid-October and is not improving.
CHART PATTERNS
- The chart shows a sharp stair-step decline from about $600 to $320, with gap-downs on Oct 13, Oct 29 and Nov 5. The most recent price action is a small sideways consolidation just under the 200D SMA, which is a Bearish Flag/Pennant-style continuation setup. It resembles the "Bearish Pennant Pattern" in the reference diagram, with a tight range between about $316 and $335 after a steep drop.
- A measured-move breakdown below $316 points toward roughly $300 (lower Bollinger Band) and then $290.
- Counter-scenario: the bounce off $316 could be an early Falling Wedge-style base, but it has not broken out and needs a close above $337-340.
POTENTIAL SCENARIOS
- Scenario 1: Bearish Continuation Lower — The pennant/flag under the SMA200D, EMA13 and VWAP resolves downward, with CMF distribution and -DI dominance driving a retest of the Nov 5 lows. Trigger: Hourly close below $316.50. Target: $305-$300 (lower Bollinger Band). Invalidation: Close above $338 (EMA13/SMA200D reclaim). (50% probability)
- Scenario 2: Neutral Range-Bound Chop — Price oscillates between $316 and $338 as the ADX cools and the MACD bounce offsets distribution. Trigger: Failure to break either $316 or $338. Target: $322-$334. Invalidation: Close outside the $316-$338 range. (22% probability)
- Scenario 3: Bullish Relief Bounce — The MACD bullish crossover and oversold RSI spark short-covering back to the Bollinger midline. Trigger: Hourly close above $338 on rising volume. Target: $350-$355. Invalidation: Drop below $316. (28% probability)
PRICE TARGETS
- Target Price: $322.00 (4-day outlook, a modest decline of about 2%)
- Expected Range: $302.00 to $345.00 (a width of $43, about 13.1% of current price, which is wide for a 4-day horizon given an ATR of $10.49 and a volatile, gap-prone stock, but it matches the elevated realized volatility)
- Key Levels: Support at $316.00, Resistance at $337.50
OVERALL BIAS
OVERALL BIAS: BEARISH - Price is below EMA13, EMA34, VWAP and the SMA200D, with -DI dominant, CMF at -0.29 showing heavy distribution, and RSI weak at 33. The MACD bounce is a mild offset, but a downside resolution of the consolidation is more probable.
This is educational analysis and not financial advice.