DELL 7-day bearish forecast — Nov 7, 2026
- Bias: Bearish
- Timeframe: 7 days (made Nov 7, 2026, target date Nov 13, 2026)
- Price at analysis: $328.58
- Price target: $321.00
- Expected range: $302.00 – $344.00
- Result: Incorrect (+3.3%) — closed at $339.40 on Nov 13, 2026; quality score 33/100
Get a free AI analysis of DELL today
Analysis
TECHNICAL INDICATORS
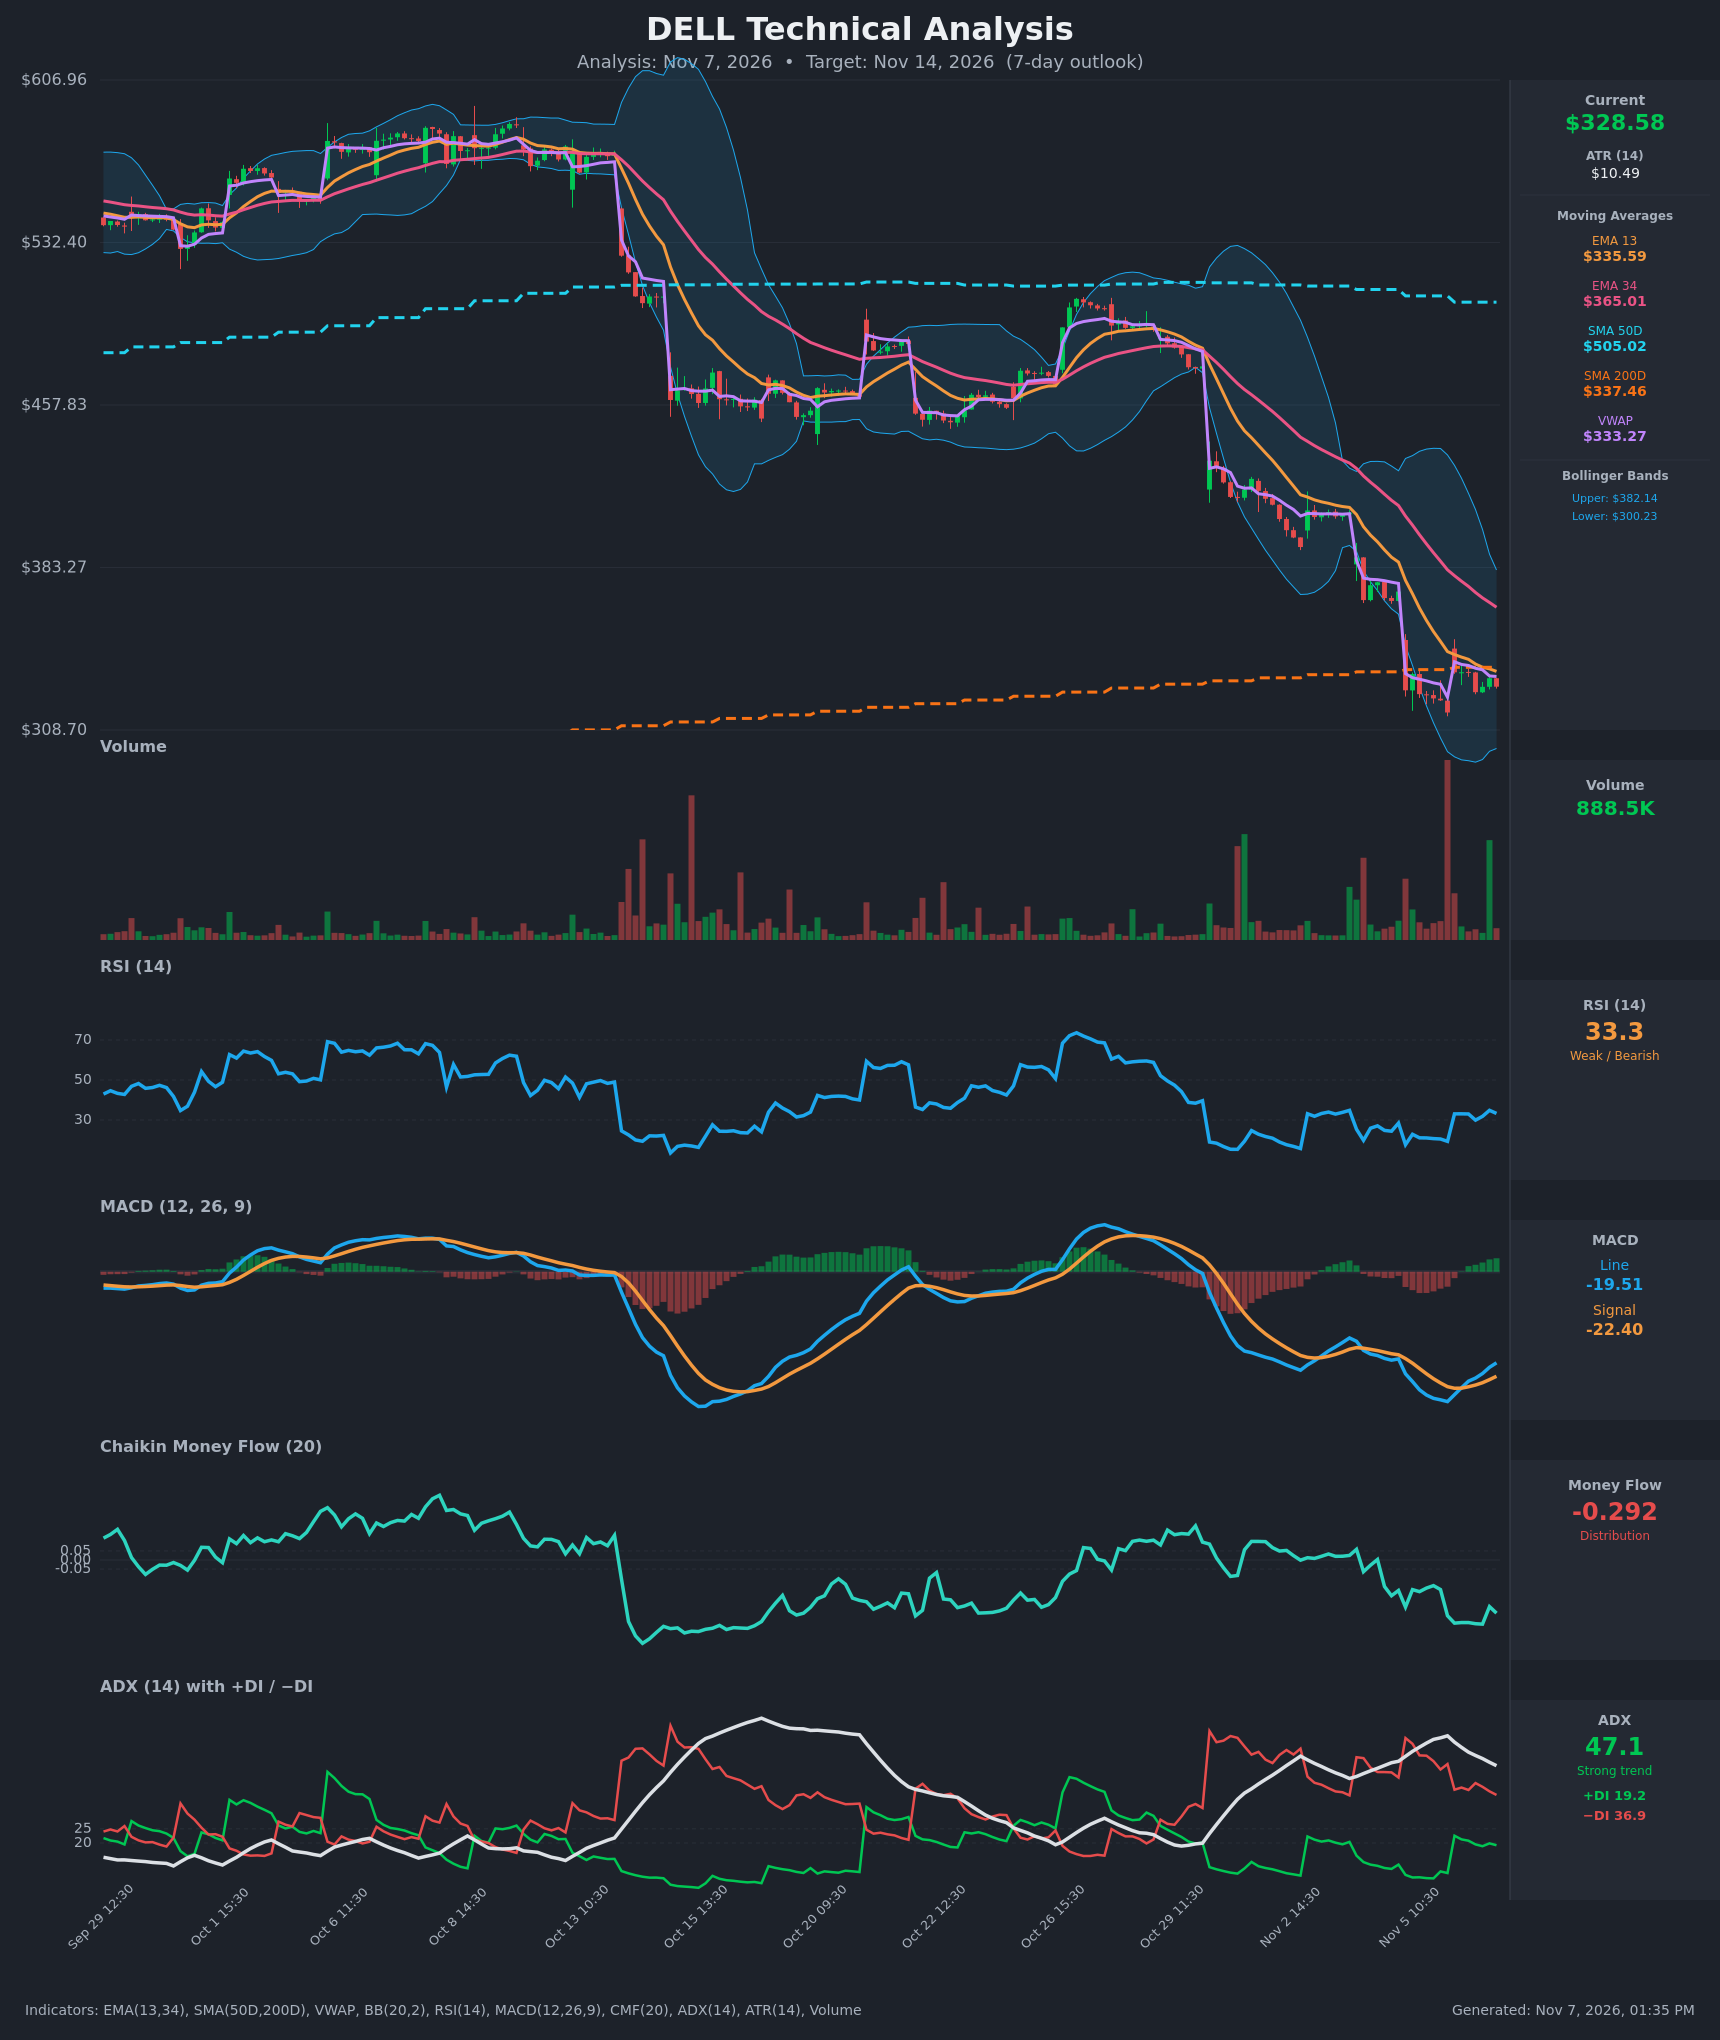
- RSI (14): 33.28, just above the oversold line. It bounced from 17-21 on Nov 5 to the low 30s and has since stalled in the 30-35 band. It has made no move above 40, so momentum is still weak but no longer in freefall. [Bearish]
- 20 EMA: The chart shows EMA 13 at $335.59 and EMA 34 at $365.01. Price at $328.58 is below both. EMA13 sits above price, EMA34 is well above it, and both are sloping down, so both act as resistance. EMA13 crossed below EMA34 earlier in the decline. [Bearish]
- MACD: Line -19.51 is above Signal -22.40, a bullish crossover that happened on Nov 6 around 10:30. The histogram has turned positive and is rising. Both lines are still deep below zero, so this is a relief bounce within a downtrend, not a trend reversal. [Neutral]
- Bollinger Bands (20): Upper $382.14, lower $300.23, so the bands are wide after the selloff. Price at $328.58 sits in the lower third, about 35% of the way up the band. The band is still sloping down and the earlier walk along the lower band has eased. A mean-reversion bounce toward the midline near $341 is possible. [Neutral]
- CMF (20): -0.292, deep in distribution territory and well below -0.05. It has been negative since Oct 13 and has not recovered. Selling pressure is persistent. [Distribution]
- ADX (14): 47.1 and falling from a peak of 57.6, with -DI 36.9 above +DI 19.2. The trend is very strong and bearish, but the falling ADX and narrowing DI gap suggest the selling is losing intensity. [Strong Trend – Bearish]
- Volume: 888.5K on the latest bar. A huge spike came on the Nov 5 breakdown, with elevated volume on the selloff. Volume has since faded on the bounce attempts, which points to capitulation followed by weak follow-through. [Neutral/Bearish]
- SMA 200D / VWAP: SMA200D is $337.46 and price is just under it, so it is acting as resistance after being lost. SMA50D at $505.02 is far above. A death cross (SMA50D below SMA200D) is not in place, but price is $176 below SMA50D. VWAP is $333.27, with price slightly below it. [Bearish]
DIVERGENCES & TRENDS
- Bullish MACD divergence (mild): Price made a lower low on Nov 5 (about $316.73), while MACD momentum has since turned up. The MACD line is still below zero, so this is only a tentative stabilization.
- RSI: Higher low (about 33 vs 19) against a flat price base. This shows selling momentum fading, but RSI is capped under 40.
- Moving averages: EMA13 and EMA34 are in a bearish stack, and SMA50D is rolling over. Price has recently been rejected around SMA200D ($337.46) and EMA13 ($335.59).
- Trend: The Nov 5 gap-down was a capitulation-style drop, and price has since consolidated in a narrow $316-$335 range.
- ADX/DI: -DI remains dominant with no bullish DI crossover. ADX is rolling over from an extreme reading, which often precedes consolidation.
CHART PATTERNS
- Primary pattern: a large downtrend with a gap-down, then a small sideways consolidation just under the 200-day SMA. It resembles a Bearish Pennant / Flag from the reference diagram, a continuation pattern with a downside break implied.
- Alternative: the base near $316-$335 could develop into a Bullish Double Bottom (lows near $316.73 and the $325 area). That would need a break above $335-$340 to confirm, and it is not yet confirmed.
- Targets: a bearish pennant measured move projects roughly $300 (the lower Bollinger band) and then lower, toward $290. A bullish resolution would aim at the $341-$365 resistance zone (BB midline, EMA34).
POTENTIAL SCENARIOS
- Scenario 1: Bearish Continuation Lower — Price fails at the EMA13/SMA200D/VWAP cluster ($333-$337) and resumes the downtrend under persistent distribution, with -DI dominant. Trigger: break below $316.73 (Nov 5 low) on rising volume. Target: $300-$305, then $290 on extension. Invalidation: close above $341 (BB midline) on strong volume. (50% probability)
- Scenario 2: Bullish Relief Bounce — The MACD bullish cross, higher RSI low and oversold conditions fuel a mean-reversion bounce to the moving-average resistance band. Trigger: close above $337.50 (SMA200D) and $340. Target: $350-$365 (EMA34). Invalidation: loss of $316. (30% probability)
- Scenario 3: Neutral Range Consolidation — Price chops between $316 and $338 as ADX continues to cool. Trigger: failure to break either $316 or $338. Target: $320-$335. Invalidation: decisive close outside the range. (20% probability)
PRICE TARGETS
For the 7-day horizon (to Nov 14, 2026), the bias leans bearish. Distribution is heavy, price is below all key resistance, and -DI dominates. A relief bounce is possible, which keeps the mean target only modestly below current price.
- Target Price: $321.00
- Expected Range: $302.00 to $344.00 (width $42 = about 12.8% of current price, wider than a 2-3 day range. Note the ATR of $10.49 implies a 7-day move of roughly ±$28, so I used the upper end of the 4-8% guideline while keeping the range realistic given the volatility.)
- Key Levels: Support at $316.00 (Nov 5 low, then $300.23 lower Bollinger band), Resistance at $337.50 (SMA200D/EMA13 cluster, then $365.01 EMA34)
OVERALL BIAS
OVERALL BIAS: BEARISH - Price is below EMA13, EMA34 and the 200-day SMA, with CMF at -0.29 showing persistent distribution and -DI far above +DI in a strong ADX trend. The MACD bounce is a weak relief signal that sits under overhead resistance at $335-$337.
This is educational analysis and not financial advice.