IBM 7-day bearish forecast — Nov 7, 2026
- Bias: Bearish
- Timeframe: 7 days (made Nov 7, 2026, target date Nov 13, 2026)
- Price at analysis: $244.95
- Price target: $241.50
- Expected range: $236.00 – $249.50
- Result: Correct (0.0%) — closed at $244.84 on Nov 13, 2026; quality score 100/100
Get a free AI analysis of IBM today
Analysis
TECHNICAL INDICATORS
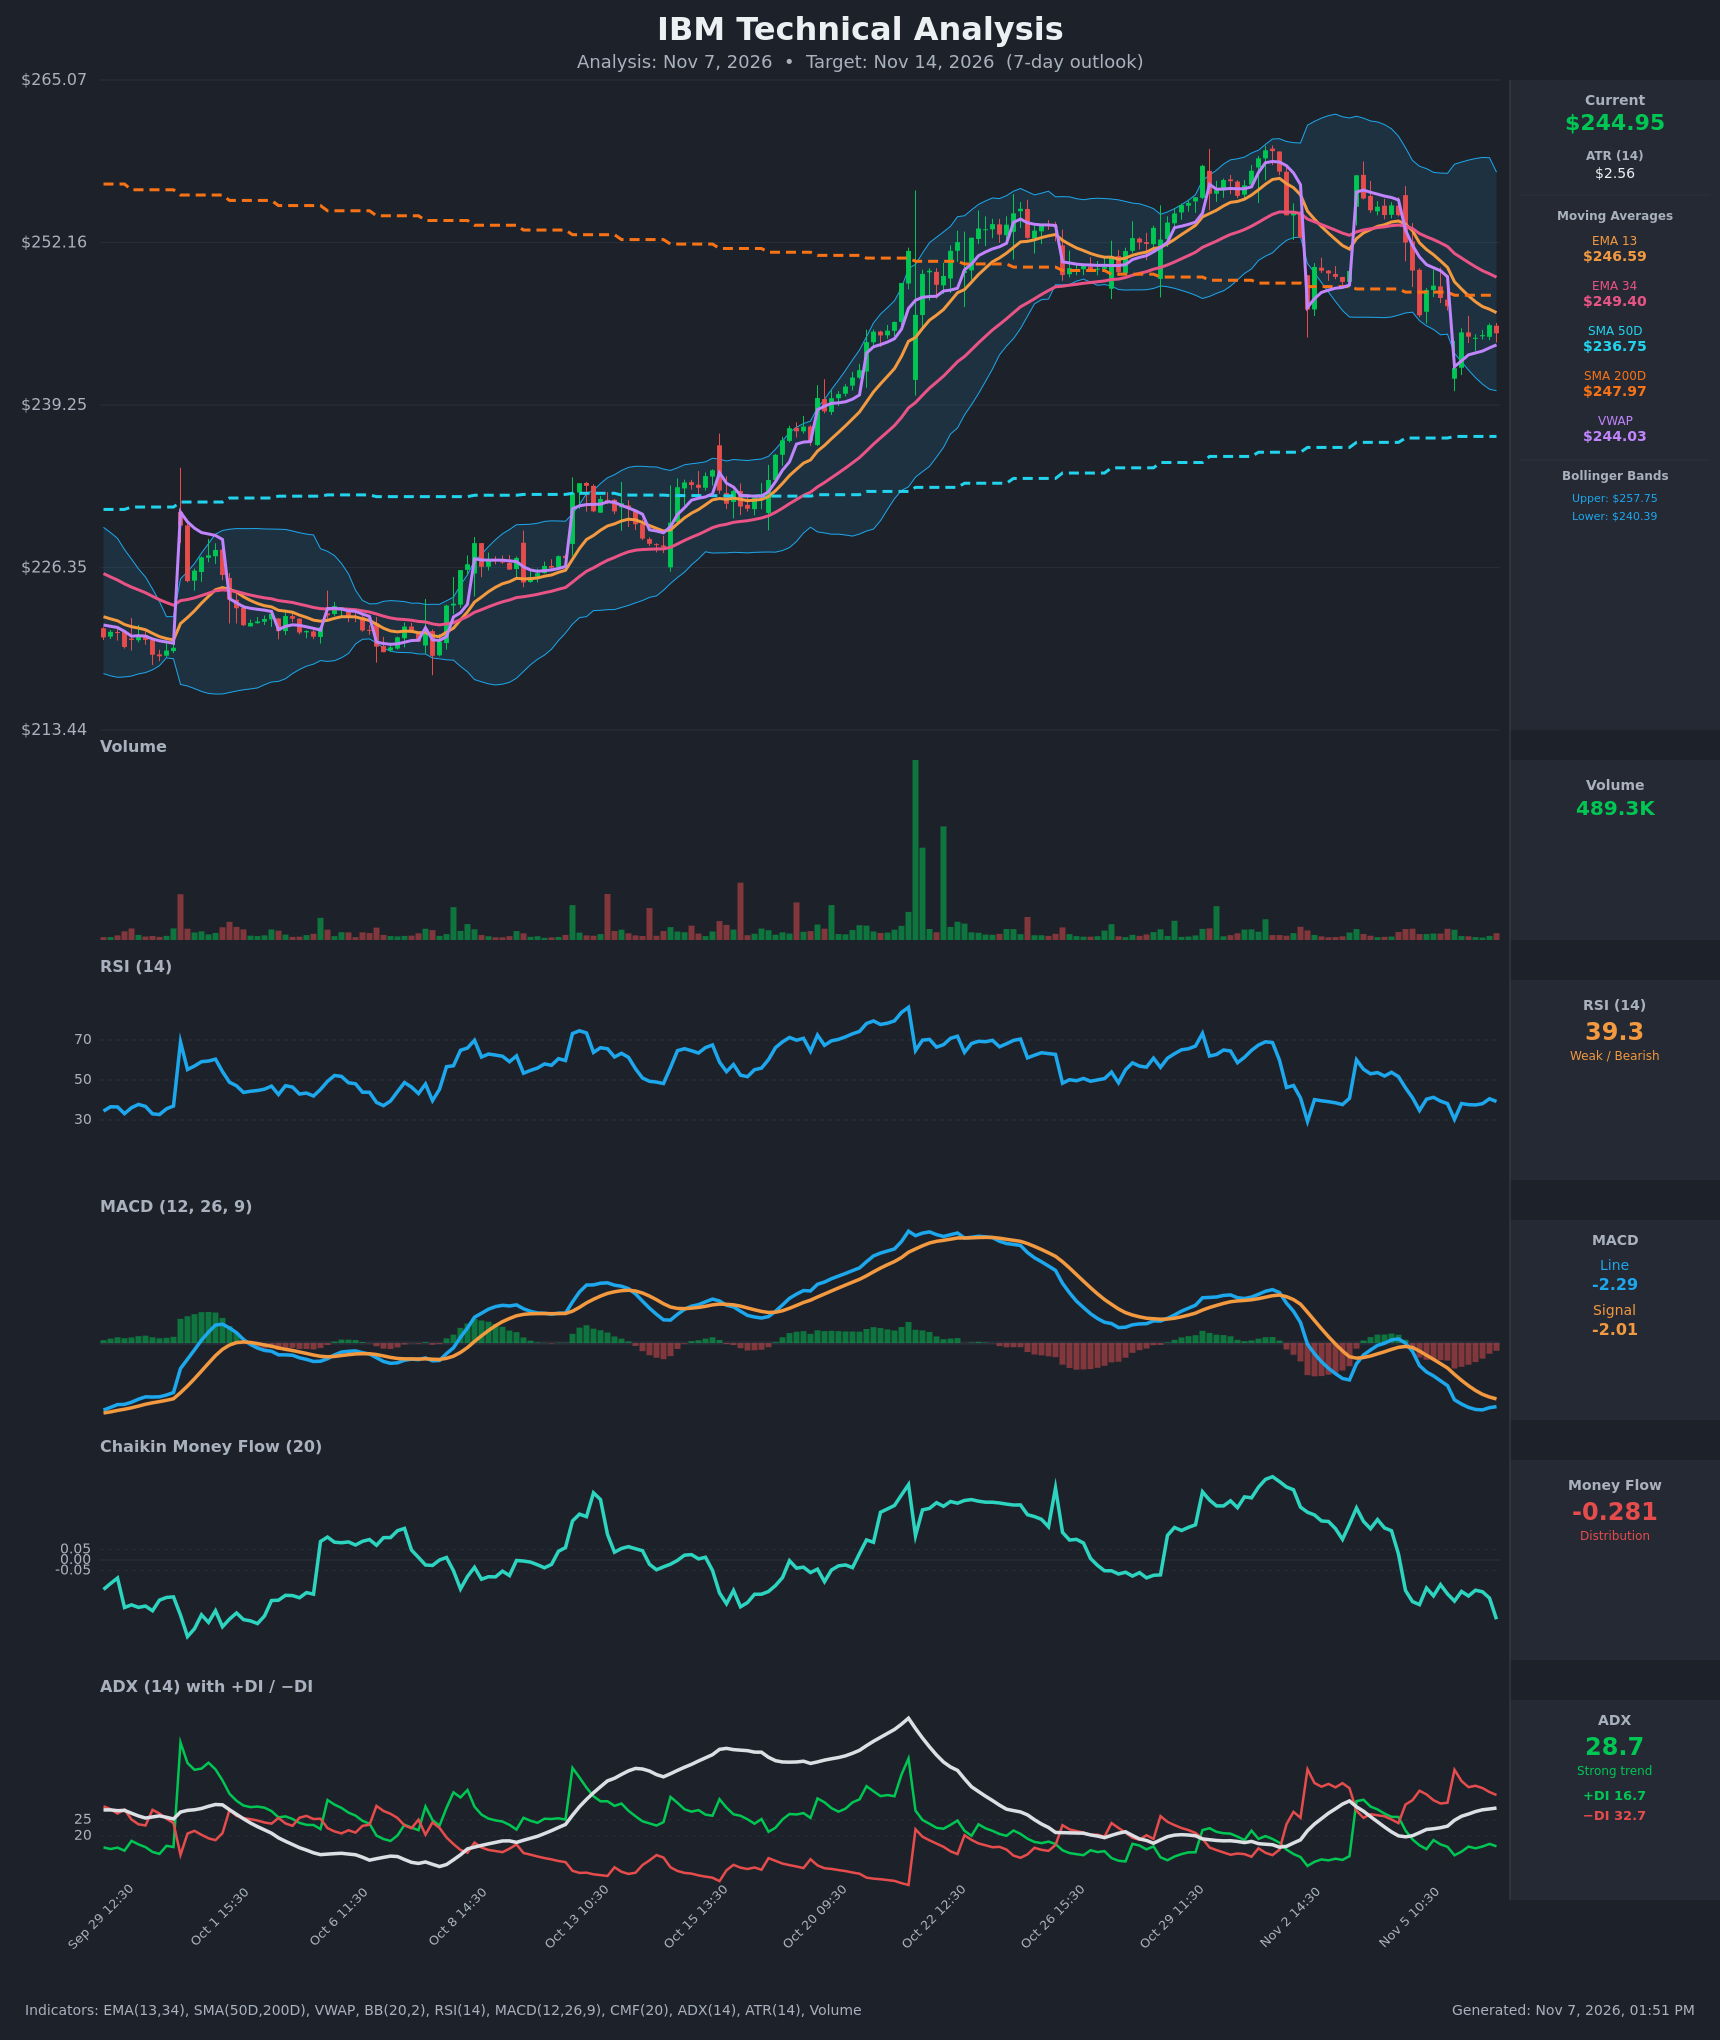
- RSI (14): 39.26, below the 50 midline and just above oversold (30). It bounced off ~30 on Nov 6 and has been flat in the high-30s to 40 since, so momentum is weak with no bullish recovery yet. [Bearish]
- 20 EMA: The chart shows EMA 13 at $246.59 and EMA 34 at $249.40. Price at $244.95 is below both, and EMA 13 is below EMA 34, so the short-term trend is down and both EMAs act as overhead resistance. [Bearish]
- MACD: Line -2.29 is below signal -2.01, with a negative and widening histogram. The bearish cross happened around Nov 5, and the line sits at its lowest level in the visible window. [Bearish]
- Bollinger Bands (20): Upper $257.75, lower $240.39, midline about $249. Price at $244.95 sits in the lower half, about 0.26 of the band width, after tagging the lower band near $240 on Nov 6. The bands are wide, so volatility is elevated. This is not a squeeze, and there is no sign yet of a reversion to the mean. [Bearish]
- CMF (20): -0.281, well below -0.05 and falling sharply from strongly positive in late October. This is heavy distribution. [Distribution]
- ADX (14): 28.7 and rising, so the trend is strong. −DI at 32.7 is well above +DI at 16.7, which means bears are in control. [Strong Trend – Bearish]
- Volume: 489.3K is light, with no capitulation spike on the recent selloff. The bounce off $240 came on thin volume, which suggests weak buying interest. Price is slightly above VWAP ($244.03), so the intraday read is only marginally supportive. [Neutral/Weak]
DIVERGENCES & TRENDS
- No bullish RSI divergence. The Nov 6 low at $242 had RSI near 30, and later bounces peaked at lower RSI readings.
- MACD, CMF and ADX/−DI are all trending down together, so the indicators confirm the price weakness.
- The EMA 13/34 bearish cross occurred around Nov 4–5. Price has since lost both EMAs, and the SMA 200D ($247.97) has been lost as well.
- SMA 50D is $236.75 and rising, and it is the nearest major support. SMA 50D is below SMA 200D, but the gap is narrowing and a golden cross would be a longer-term event, not a 7-day factor.
- Price is slightly above VWAP, which is a small positive. It is the only mildly constructive signal.
CHART PATTERNS
- The decline from the $258 area to $242 and the small bounce resemble a Bearish Flag / Descending Channel, a continuation pattern. The recent lower highs and lower lows in the $244–$246 area support this.
- The rally from $225 to $258 followed by a rollover also loosely resembles a Double Top / rounded top (peaks near $258 in late October and $257 in early November). The neckline is around $242–$240, which is the lower Bollinger Band and the Nov 6 low. A break below it would project toward about $236–$237, which is where SMA 50D sits.
- The flag-type pattern projects toward the $238–$240 area.
POTENTIAL SCENARIOS
- Scenario 1: Bearish Continuation Toward SMA 50D — The bounce fails below the EMA 13/34 and SMA 200D cluster ($246.6–$248). Price breaks the $242 low and heads for the rising SMA 50D, supported by −DI dominance, distribution and a negative MACD. Trigger: break below $242. Target: $238–$239. Invalidation: close above $248.5. (55% probability)
- Scenario 2: Neutral Range Chop — Price is supported by VWAP and the lower Bollinger Band and trades between $241 and $248 as oversold conditions are worked off. Trigger: holds $241–$242 on a retest. Target: $244–$246. Invalidation: break of $241 or close above $248. (20% probability)
- Scenario 3: Bullish Relief Rally — Oversold bounce with RSI turning up. Price reclaims EMA 13 and EMA 34 and moves back toward the Bollinger midline. Trigger: close above $247 on rising volume. Target: $249–$251. Invalidation: loss of $242. (25% probability)
PRICE TARGETS
- Target Price: $241.50
- Expected Range: $236.00 to $249.50 (width $13.50, about 5.5% of current price, in line with the 4–8% guidance for 7 days)
- Key Levels: Support at $240.40, Resistance at $247.97
OVERALL BIAS
OVERALL BIAS: BEARISH - −DI is far above +DI with ADX at 28.7 and rising, MACD is below its signal and falling, CMF shows heavy distribution (-0.281), and price is below both EMAs and SMA 200D, with a flag/double-top-type structure pointing toward the $238–$240 area.
This is educational analysis and not financial advice.